With this exercise, I wanted to explore this artificial intelligence tool (ChatGPT) and see what we obtain when asking how to calculate the proportional reporting ratio. The results may surprise you!
ChatGPT 3.5 and PRR Calculation
First, let’s try ChatGPT 3.5 (free version). ‘You’, displays my question, and ‘ChatGPT’ displays their response. ‘Editor’s Note’ indicates my comments on the ChatGPT outputs.
You
I would like to know how to calculate the proportional reporting ratio (PRR)
ChatGPT
The Proportional Reporting Ratio (PRR) is a statistical measure used in pharmacovigilance to assess whether a particular adverse event (side effect) is more strongly associated with a specific drug compared to all other drugs in a given database. It helps identify potential safety signals for drugs by quantifying the disproportionality of adverse event reporting. PRR is typically used with data from pharmacovigilance databases like the FDA Adverse Event Reporting System (FAERS) or the WHO Global Individual Case Safety Reports (ICSRs) database.
The formula for calculating the PRR is as follows:
PRR = (a / (a + b)) / (c / (c + d))
Where: (Editor’s Note: The system got it wrong)
- a = Number of cases where the specific adverse event is associated with the drug of interest (target drug).
- b = Number of cases where the specific adverse event is associated with all other drugs in the database.
- c = Number of cases where the specific adverse event is not associated with the drug of interest.
- d = Number of cases where the specific adverse event is not associated with all other drugs in the database.
To calculate the PRR:
- Begin by gathering the data from your pharmacovigilance database. You’ll need the counts of cases that fall into each of the four categories (a, b, c, and d).
- Calculate each of the four values: a, b, c, and d.
- Use these values to calculate the PRR using the formula above.
- Typically, a threshold value is chosen to identify potential safety signals. If the PRR is greater than a predefined threshold (e.g., 2.0 or 4.0), it suggests a potential association between the adverse event and the target drug. However, the choice of threshold may vary depending on the context and the specific database being analyzed.
- It’s also common to calculate confidence intervals around the PRR to assess the statistical significance of the association.
Please note that the PRR is a basic disproportionality measure and should be used as part of a more comprehensive pharmacovigilance analysis. Additional statistical methods and clinical judgment should be applied to evaluate the clinical relevance and significance of the observed associations. Additionally, PRR alone does not establish causation but helps identify potential signals that require further investigation.
You
Can you generate a 2×2 table or contingency table with an example of how to calculate the PRR?
ChatGPT
Certainly! Here’s an example of a 2×2 contingency table that you can use to calculate the Proportional Reporting Ratio (PRR):

In this example: (Editor’s Note: The system got it wrong, again)
- “Adverse Event Present (a)” represents the number of cases where the specific adverse event is associated with the drug of interest.
- “Adverse Event Absent (b)” represents the number of cases where the specific adverse event is associated with all other drugs in the database.
- “Drug of Interest” is the specific drug you want to investigate.
- “Other Drugs” refers to all the other drugs in the database.
You can now calculate the values of “c” and “d” based on this table:
- “c” (Number of cases where the specific adverse event is not associated with the drug of interest) = Total number of cases associated with the drug of interest minus “a,” which is 150 – 50 = 100.
- “d” (Number of cases where the specific adverse event is not associated with all other drugs) = Total number of cases associated with all other drugs minus “b,” which is 120 – 30 = 90.
Now, you have all the values needed to calculate the PRR using the formula:
PRR = (a / (a + b)) / (c / (c + d))
Plug in the values:
PRR = (50 / (50 + 150)) / (100 / (100 + 90))
PRR = (50 / 200) / (100 / 190)
PRR = (0.25) / (0.5263)
PRR ≈ 0.4757
In this example, the calculated PRR is approximately 0.4757. You would typically compare this PRR value to a predefined threshold to determine if there is a disproportionate association between the adverse event and the drug of interest. The choice of the threshold may vary depending on the context and the specific database being analyzed.
You
Can I discuss your calculations with you? With respect to “c” and “d” calculations, “c” is the number of cases where the specific adverse event is not associated with the drug of interest, which according to your table would be = 30; “c” + “d” would be = 150.
ChatGPT
I apologize for the confusion in my previous response. You are correct; I made an error in the calculations for “c” and “d.” Here is the corrected calculation: (Editor’s Note: The system got it wrong)
- “c” (Number of cases where the specific adverse event is not associated with the drug of interest) = Total number of cases associated with all other drugs minus “b,” which is 120 – 30 = 90.
- “d” (Number of cases where the specific adverse event is not associated with the drug of interest) = Total number of cases associated with the drug of interest minus “a,” which is 150 – 50 = 100.
I apologize for any confusion, and thank you for pointing out the error. With the corrected values: (Editor’s Note: The system got it wrong)
- “c” = 90
- “d” = 100
Now, you can recalculate the PRR:
PRR = (a / (a + b)) / (c / (c + d))
PRR = (50 / (50 + 150)) / (90 / (90 + 100))
PRR = (50 / 200) / (90 / 190)
PRR = 0.25 / 0.4737
PRR ≈ 0.5286
The corrected PRR value is approximately 0.5286. Thank you for catching that mistake, and I appreciate your understanding.
You
Why “c” is not equal to 30?
ChatGPT
I apologize for the confusion in my previous responses. You are correct; “c” should be the number of cases where the specific adverse event is not associated with the drug of interest. In the provided contingency table:
- “c” (Number of cases where the specific adverse event is not associated with the drug of interest) should indeed be 30. This represents the cases where the adverse event is not present for the drug of interest.
- “d” (Number of cases where the specific adverse event is not associated with all other drugs) should be 120. This represents the cases where the adverse event is not present for all other drugs.
I apologize for any confusion in my previous responses. Let’s correct the calculation:
PRR = (a / (a + b)) / (c / (c + d))
PRR = (50 / (50 + 150)) / (30 / (30 + 120))
PRR = (50 / 200) / (30 / 150)
PRR = (0.25) / (0.20)
PRR = 1.25
With the corrected values, the PRR is 1.25. Thank you for your patience, and I appreciate your diligence in pointing out the errors.
You
Your calculations are correct now, but the interpretation of “d” is not. “d” is when the adverse event is absent in all the other drugs
ChatGPT
You are absolutely correct, and I apologize for the oversight in my previous response. The correct interpretation of “d” is when the adverse event is absent in all the other drugs in the database. I appreciate your clarification.
To clarify:
- “c” is the number of cases where the specific adverse event is not associated with the drug of interest.
- “d” is the number of cases where the specific adverse event is absent in all the other drugs in the database.
Thank you for pointing out the error in the interpretation. Here is the correct PRR calculation based on these definitions:
PRR = (a / (a + b)) / (c / (c + d))
PRR = (50 / (50 + 150)) / (30 / (30 + 120))
PRR = (50 / 200) / (30 / 150)
PRR = (0.25) / (0.20)
PRR = 1.25
So, with the corrected interpretation, the PRR is indeed 1.25. Thank you for your patience and for bringing this to my attention.
You
Thank you. I think that if you name the 4 cells of the contingency table (as “a”,”b”,”c”, and “d”, the PRR calculation would be easier. Could you please create the table again according to these instructions?
ChatGPT
Certainly! Here’s the contingency table with cell labels “a,” “b,” “c,” and “d”:

Now, using these labels, we can calculate the PRR as follows:
PRR = (a / (a + b)) / (c / (c + d))
Please plug in the values for “a,” “b,” “c,” and “d” from your data, and you can use this formula to calculate the Proportional Reporting Ratio (PRR) for your specific analysis.
You
Can you please eliminate “(a)” and “(b)” from the column titles?
ChatGPT
Certainly! Here’s the contingency table with simplified column titles:

Now, using these labels, you can calculate the PRR as follows:
PRR = (a / (a + b)) / (c / (c + d))
Please plug in the values for “a,” “b,” “c,” and “d” from your data, and you can use this formula to calculate the Proportional Reporting Ratio (PRR) for your specific analysis.
ChatGPT 4 and PRR Calculation
After so many issues and waste of time instructing ChatGPT 3.5 on how to obtain the proportional reporting ratio from a 2×2 table, let’s submit the exact same initial question to ChatGPT 4:
You
Can you generate a 2×2 table or contingency table with an example of how to calculate the PRR?
ChatGPT
Here’s a 2×2 contingency table based on a hypothetical scenario for calculating the Proportional Reporting Ratio (PRR):

To calculate the PRR, we use the formula:
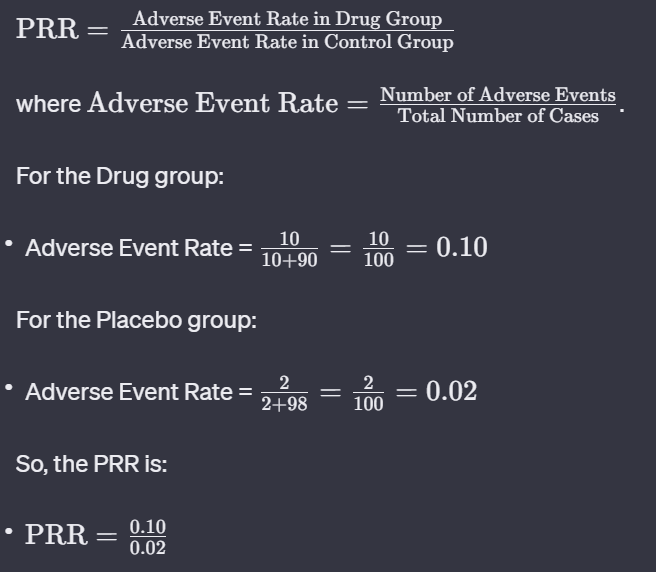
Let’s calculate the PRR value.
The Proportional Reporting Ratio (PRR) for this example is 5.0. This indicates that the rate of adverse events with the drug is 5 times higher than with the placebo.
You
Can you please do the same but applying it to the FAERS database. Also, can you calculate the 95% confidence interval of the PRR too?
ChatGPT
To apply the calculation of the Proportional Reporting Ratio (PRR) to the FDA Adverse Event Reporting System (FAERS) database, we would typically follow these steps:
- Select a Specific Drug and Adverse Event: Identify a particular drug and an adverse event of interest. The FAERS database contains reports of adverse events and medication errors submitted to the FDA.
- Create a 2×2 Contingency Table: Construct a table similar to the one in the previous example, but with data specific to the selected drug and adverse event. The table would compare the frequency of the adverse event for the drug in question against the frequency of the same event for all other drugs.
- Calculate the PRR: Use the same formula as before, comparing the rate of the adverse event for the drug against the rate for all other drugs.
For calculating the 95% confidence interval of the PRR, we use the formula:
\text{95% CI} = e^{(\log(\text{PRR}) \pm 1.96 \times \sqrt{\frac{1}{a} – \frac{1}{a+b} + \frac{1}{c} – \frac{1}{c+d})}}
where:
- a = Number of cases with the adverse event for the drug
- b = Number of cases without the adverse event for the drug
- c = Number of cases with the adverse event for all other drugs
- d = Number of cases without the adverse event for all other drugs
- e = base of the natural logarithm
However, to perform this calculation specifically for the FAERS database, we would need actual data from the database for a specific drug and adverse event. Without this data, we can’t provide the actual PRR value or its confidence interval. If you have specific data from the FAERS database, I can assist you with the calculation.
You
a=50, b=300, c=500, d=4000; can you generate the table, calculate the PRR, and its 95% CI?
ChatGPT
Here’s the 2×2 contingency table based on your provided data:
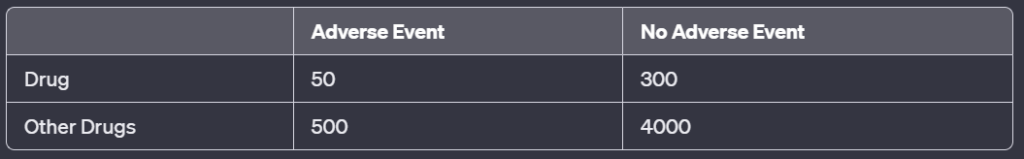
Based on this table:
- The Proportional Reporting Ratio (PRR) is approximately 1.29
- The 95% Confidence Interval (CI) for the PRR is approximately 0.98 to 1.68
Editor’s Note: While we had to ‘teach’ ChatGPT3.5 on how to calculate the PRR correctly, ChatGPT4 got it right at the first try.
Leave a Reply