• Skip to primary navigation
  • Skip to main content
  • Skip to primary sidebar

Pharmacovigilance Analytics

Your best resource for PV analytics news, content and innovation!

  • Home
  • Pharmacovigilance Analytics
    • Sources of data
    • Methods and tools
  • Signal Detection and Management in Pharmacovigilance
  • News
  • Opinion
  • About
  • Glossary

Jose Rossello

Knowledge Graphs, Semantic Web and Drug Safety

July 12, 2019 by Jose Rossello 1 Comment

Second part of: Mining PubMed for Drug Induced Acute Kidney Injury

When I wrote “Mining PubMed for Drug Induced Acute Kidney Injury”, my intention was to start exploring the use of PubMed for knowledge discovery in the fields of drug safety and pharmacovigilance. But to discover new knowledge, you need to know what is already known, what has been discovered already.

Using our example of drug induced acute kidney injury (AKI), if we want to discover new associations, we should be aware of which drugs are known to increase the risk of renal damage, or to worsen renal function on an already impaired kidney.

For marketed, prescription drugs, we can use the FDA labels as a reference of what adverse reactions are already known for a specific product, and check them against our PubMed search, for knowledge discovery.

How can we reach that goal? First, it is helpful to know that the FDA provides us with the labels of all approved products, in xml format. To download FDA labels click here.

To understand this approach, we need to talk about a variety of concepts and how they can help us to reach our objectives:

Semantic Web

The Semantic Web is a Web 3.0 technology. It is a way of connecting data between entities or systems that allows for rich, self-describing interactions of data available worldwide across the Internet. Nowadays, the majority of information provided by the Internet is delivered in the form of web pages. These documents are linked each other through the use of hyperlinks. Humans or machines can read these documents. But machines, other than finding keywords on a page, have difficulties extracting any meaning from these documents.

The semantic web will open the web of data to artificial intelligence processes, it seeks to encourage people to publish their data in an open standard format, at the same time that encourages Internet users to analyze these data and gain knowledge.

The Graph Database

The graph database is the way the semantic web stores data. The Resource Description Framework, or RDF, constitutes the building blocks for forming the web of semantic data, and it defines a type of database which is called a graph database.

Data can be stored in the form of triples. A triple describes the breaking of an RDF statement into its 3 constituent parts: the subject, the predicate (or property), and the object of the statement. For example, we want to define the color of a capsule for a medicinal product:

In terms of this simple graph, the subject is the capsule; the predicate (or property) is color; and the object is red. That’s why this is called a “triple”, and the information is stored in triples.

Semantic Modeling

RDF offers a flexible, graph-based model for recording data that is interchangeable globally, and this is the beauty of it. However, it does not offer any means of recording semantics, or meaning.

We want to include semantics in data, for the purpose of knowledge integration. One of the most important benefits of adding semantic meaning to our data is that it can be bridged across domains of knowledge automatically. For example, suppose we have two websites, one of them stores information about product labels, including all adverse reactions, and the other stores information about treatments given to a specific group of patients. Although these 2 sites have been created independently, the information they provide is complementary.

In principle, any sharing of data between the 2 sites cannot be done, in principle, by joining tables in their databases. This is because they have been designed independently, and because they are using different database server systems, which are not cross-compatible. This type of information interchange across incompatible, independently defined data systems takes time, money, and human contextual interpretation of the different sources of data. It is also limited to these 2 websites / datasets. Any further additions to their knowledge from elsewhere would require a similar effort.

With the introduction of semantics and RDF, all this is much easier to do. How do we model the two site scenario using semantic modeling? To begin with, the 2 sites need to apply a common, standard vocabulary (a collection of terms with a well-defined meaning that is consistent across contexts). This can be done if the two sites adopt the same ontology (to define contextual relationships behind a defined vocabulary), for expressing the meaning behind the data they expose, and publishing the data on an endpoint which can be queried, so that the sites can communicate with each other across the web.

NOTE: Currently you can download from the Web thousands of databases encoded as triples. Among the largest ones we highlight DBpedia, which is the triple-store version of Wikipedia.

Example Applied to Drug Safety – Drug Induced Acute Kidney Injury

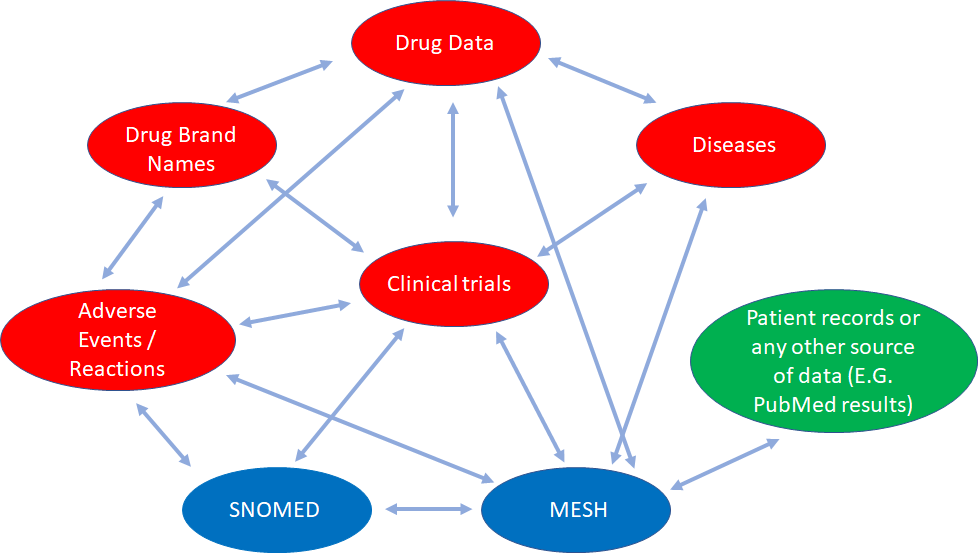
In this example we can see how different databases containing partial health-related information that are conceptually interconnected, can be linked for knowledge discovery.

Data from SNOMED (global common language for health terms), MeSH (Medical Subject Headings, a comprehensive controlled vocabulary for the purpose of indexing journal articles and books in the life sciences), SIDER (Side Effect Resource), DailyMed (drug brand names and FDA product labels), ClinicalTrials.gov (web data source for clinical trials), DrugBank (comprehensive data about medicinal products), and the Diseasome (integrated database of genes, genetic variation, and diseases), along with any patient record data, or even PubMed data can be interlinked and queried. It opens a myriad of opportunities. And this is just a small example of what we can do.

Graphic-Based, Triple-Store Browser

We are going to use a tool to display visual graphs of subsets of a store’s nodes and their links. It is an interactive tool for browsing, querying, and editing triple-stores, also known as graph databases.

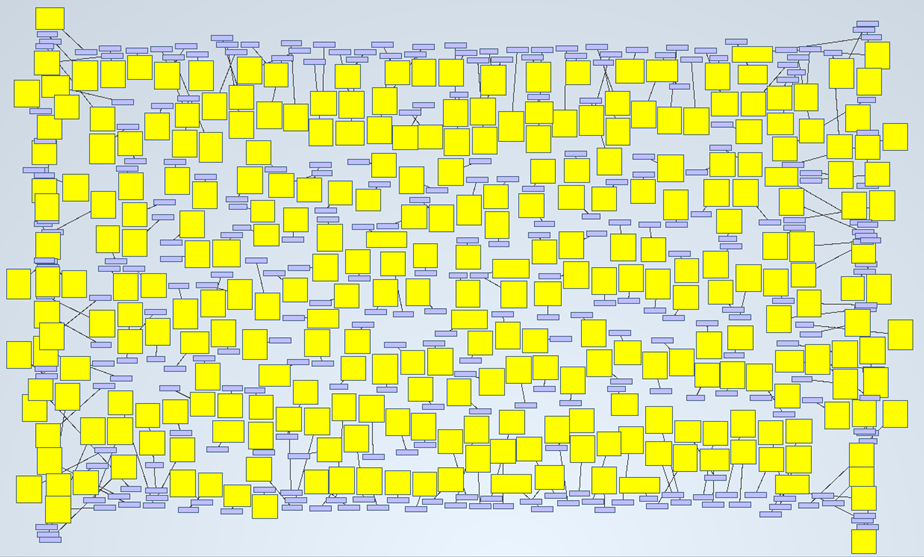
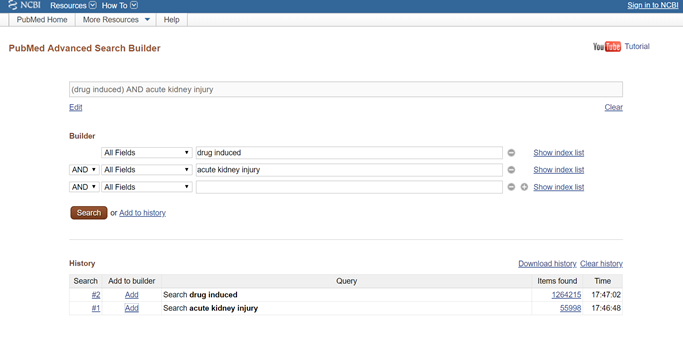
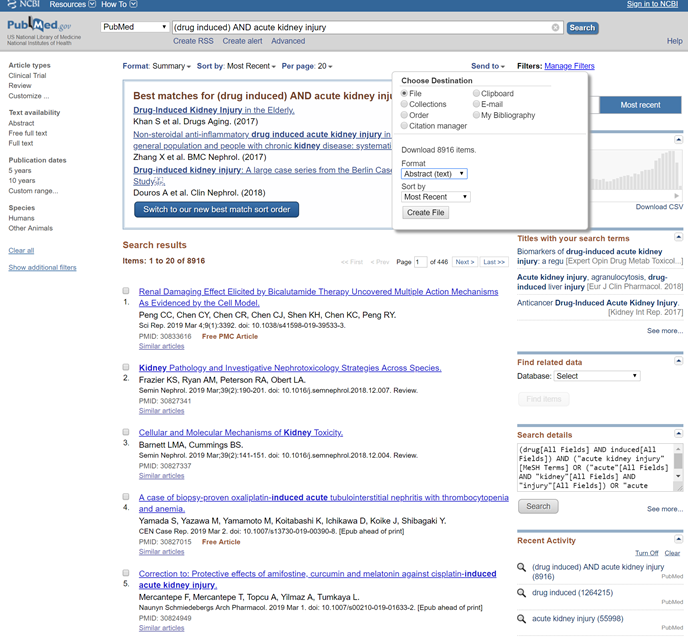
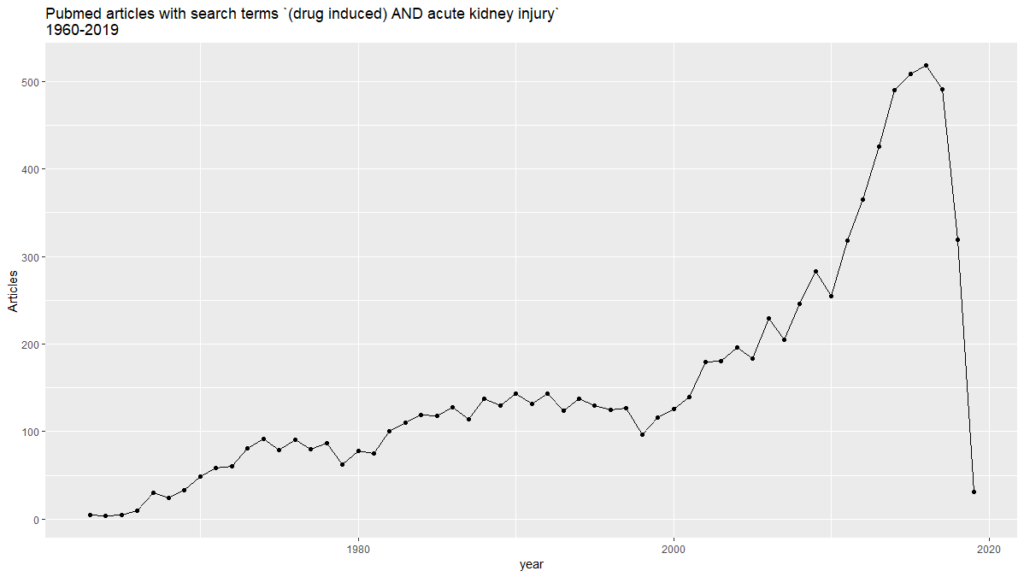
On the previous post of this series, we found 8,916 PubMed abstracts for the search of drug induced acute kidney injury. We downloaded all the abstracts as an xml file. Some applications are able to obtain triples from them, in such a way that allows us to analyze them graphically. In this case, we got 2,705,300 triples from the mentioned PubMed results.

A simple example of it is shown on the next picture. We wanted to know how many abstracts were talking about “acute kidney injury”. By searching that keyword, the tool delivered 599 nodes (abstracts) and 300 links:

Abstracts are represented by yellow boxes

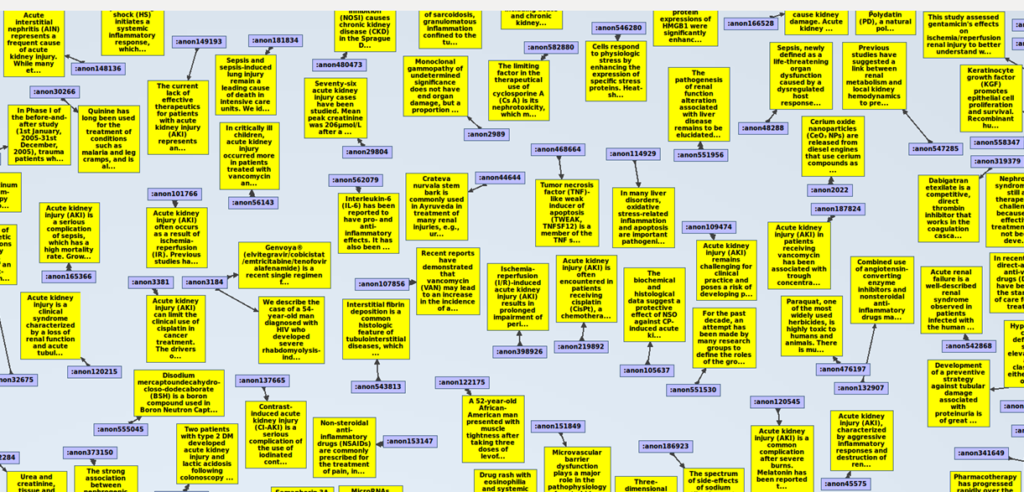
If we zoom in, we will see this:

Some abstracts using the keyword “acute kidney injury”

Let´s see how the triples look like in this graph database. Remember that we have converted the xml file into a triple-store, and that triples consist of Subject, Predicate, Object. Following there is a list of the 83 predicates extracted from the PubMed xml file we are using for this example, in alphabetical order:

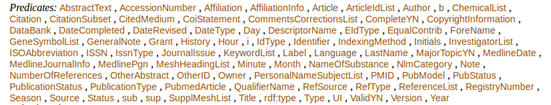
Follow this link if you want to learn more on PubMed XML Element Descriptions and their attributes.

These predicates are the properties of each one of the articles we retrieved. The subject would be a unique identifier for each article, the predicate is one among the previous list, and the object is the value of the predicate for that specific article.

Some sample triples from the dataset are shown here:

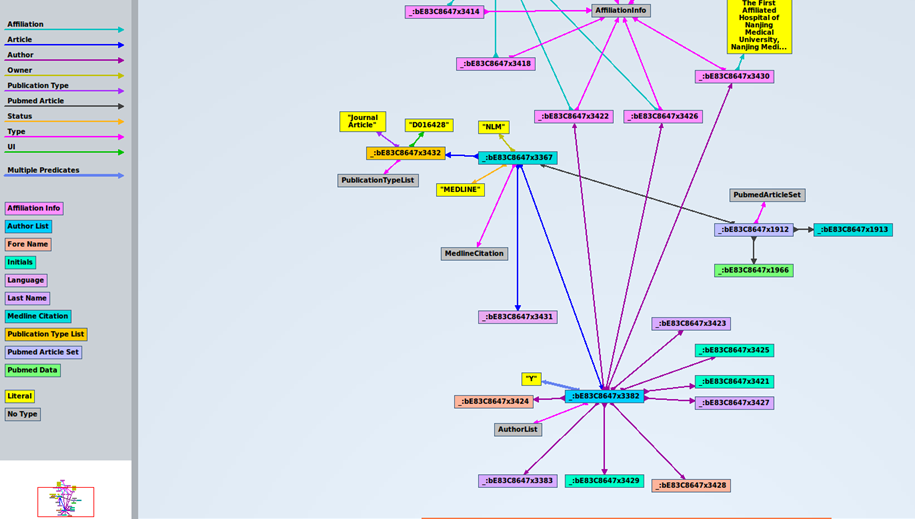
Next, we can see the first triples of the dataset, where column “s” is for subjects, “p” is for predicates, and “o” is for objects:

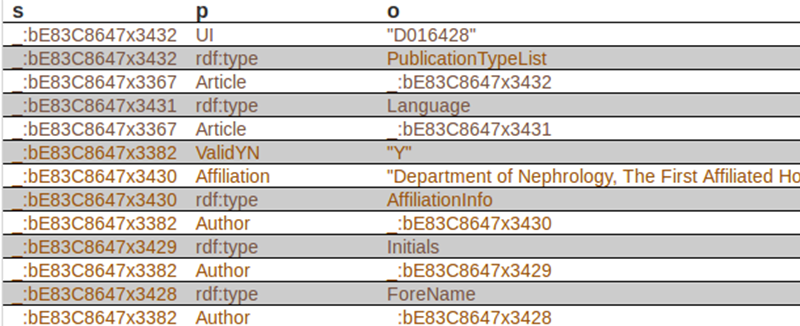
The first subject is _:bE83C8647x3432, corresponds to a specific article. The corresponding predicate (property) is UI, and the object is D016428. In case you want to know, this element is used to identify they type of article indexed by MEDLINE. There is a code for each type of article. “D016428” is the code for the object “Journal Article”. Records may contain more than one publication type. In our case, this record contains just one publication type. In xml, it looks like this:

<PublicationTypeList>
<PublicationType UI=”D016428″>Journal Article</PublicationType>
….
</PublicationTypeList>

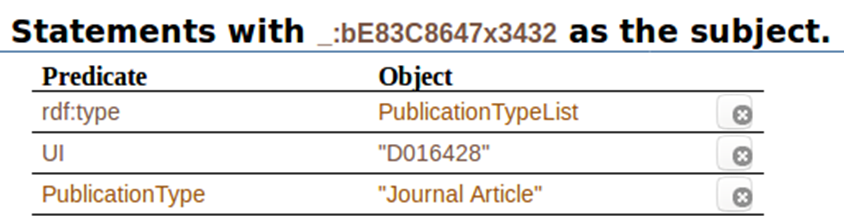
When we click on ” _:bE83C8647x3432″, this is what we get all the statements with that code as the subject. It shows the predicates associated to it, and the objects associated to the predicates:

In this post, we have talked about knowledge graphs, semantic web, triples, and have shown some of them, applied directly to our PubMed search on drug induced acute kidney injury. The next post will show more about it, and more results from including other, completely different, sources of data.

Jose Rossello
Jose Rossello

Filed Under: Text Mining Tagged With: acute kidney injury, cognitive computing, knowledge graph, semantic web, text mining

Review of Safety in FDA Medical Reviews

March 24, 2019 by Jose Rossello 3 Comments

Analysis of the latest review of safety sections for new drug applications (NDAs and BLAs)

I found interesting to analyze the latest Reviews of Safety for the FDA submission classification Type 1 – New Molecular Entity. To obtain the medical reviews I accessed the FDA Approved Drug Products web page, and selected “Drug Approval Reports by Month”, and then “Original New Drug Approvals (NDAs and BLAs) by Month. I chose twenty clinical reviews, from October 2018 to March 2019.

Some of the clinical reviews were found as individual documents on the approval package, under the name of “Medical Reviews“, while other clinical reviews were embedded into a big file named “Multi-discipline Review“, containing the summary review, office director, cross discipline team leader review, clinical review, non-clinical review, statistical review, and clinical pharmacology review.

Another interesting aspect of this analysis is that older reviews have a specific headline for “Reviewer comments”, being each section followed by the comments of the reviewer at the end of it. However, more current clinical reviews do not differentiate the reviewer comments; actually, it looks like all text comes from the reviewer, instead of separating what the applicant submitted from what the reviewer commented. I think the newer approach is better, as the reviewers elaborate their thinking in a more extensive fashion.

If you are in a hurry, just go to the Conclusions at the end of this post.

CDER Clinical Review Template

According to the CDER Clinical Review Template 2015 for New NDA or BLA, the Review of Safety outline is as follows:

1. Review of safety
1.1 Safety review approach
1.2 Review of the safety database
1.3 Adequacy of applicant’s clinical safety assessments
1.4 Safety results
1.5 Analysis of submission-specific safety issues
1.6 Specific safety studies / clinical trials
1.8 Additional safety explorations
1.9 Safety in the postmarket setting
1.10 Additional safety issues from other disciplines
1.11 Integrated assessment of safety

However, although the basic outline for the review of safety section is the same, there are some variations, depending on the drug evaluated, wheter or not a subsection is pertinent and, possibly, the reviewer preferences or style.

Let’s go through each section and analyze what the reviewers have to say.

Safety review approach

Reviewers explain what the evaluation of safety for the product in questions is based on, which is, most of the time clinical trials. Among the clinical trials, which ones contribute the most, whether or not they perform pooling of data from different trials, and which treatment arms are to be considered.

Also, reviewers determine whether or not the methods to assess safety in the individual clinical trials and in the integrated summary of safety are considered appropriate.

FDA performs their own analysis using a variety of applications for drug safety analytics, like MedDRA Adverse Event Diagnosis Service (MAED), JMP amd JMP Clinical, while using analysis data model (ADAM) and study data tabulation model (SDTM) data sets, looking for differences in findings by the FDA reviewer compared to the applicant, among other aspects of the analysis.

If there are adverse events of special interest (AESI), they are stated here.

Review of the safety database

The review of the safety database includes the overall exposure, relevant characteristics of the safety population, and the adequacy of the safety database.

Overall exposure is summarized in a table. Depending on the product, the table may content number of individuals by arm, and if for example race is an important variable to understand pharmacokinetics (PK) data, that information should be included too, at least in the text.
Duration of exposure is an important aspect of exposure described here. They make a lot of emphasis in comparing median exposure times among groups. Reviewers will be concerned if those times are significantly different.

In this section, relevant characteristics of the safety population are also described. Demographics and baseline characteristics are included. Populations that are underrepresented are also highlighted. Whether or not important subgroup populations are well represented is something reviewers take into account. It is important to highlight whether or not the final safety database is well balanced in terms of baseline demographics and disease characteristics.

With respect to the adequacy of the safety database, the reviewers determine if the data are sufficient as to characterize the safety profile of the product. They evaluate if the total number of individuals in the safety database is enough or lower than recommended in FDA guidance, depending on the product under study. On occasions, the reviewer may recommend adding additional information to confirm safety of long-term use of the investigational product, in general or in specific subpopulations (like older people).
Another aspect of relevance is if there are evidence of safety signals in the clinical and pre-clinical development program.

Adequacy of applicant’s clinical safety assessments

Reviewers evaluate:
– Issues regarding data integrity and submission quality, that have an effect on the safety review.
– Categorization of adverse events. Adverse event and serious adverse event definitions are evaluated, as well as the safety reporting period for SAEs. Identification of issues with respect to recording. coding, and categorizing AEs, and if the applicant has used SOC and PTs applying MedDRA coding. Categorization of AE severity according to the CTCAE criteria is used in the majority of occasions. Interestingly, they tend to perform analysis of AEs/SAEs Grade 3 and up. Basis for the causality assessment. MedDRA version is also stated, as well as the selection of PTs by the use of Standardized MedDRA Queries (SMQ).
– Routine clinical tests, pregnancy tests, and acceptability of the schedule of events.

Safety results

Here reviewers pay attention, specifically to:
– Deaths. Reviewers evaluate whether or not they agree with applicant assessment of relatedness with the use of the investigational product.
– Serious Adverse Events (SAEs). Same as for deaths, reviewers make an opinion of agreement / disagreement with Company causality for each one of the SAE cases, as well as for the death cases.
– Dropouts and/ or discontinuations due to adverse effects. Here there is an evaluation of AEs leading to discontinuation. These significant adverse events are evaluated in terms of severity (defined by the applicant), and of the presence of patterns or concerns for these events. Distinction is made here to not include patients who discontinued due to events related to the disease rather than to the product.
– Treatment emergent adverse events (TEAEs) and adverse reactions. In general, this is the section where AEs are presented in tables, depending on the percentage of occurrence by study arm. Sometimes reviewers recommend including laboratory-related adverse reactions in a separate table in the package insert.

INTERESTING: Adverse Reactions. In one study, the applicant defined Adverse drug reaction as: “one that was reported in at least 2% of subjects who received the investigational product, occurred at a higher incidence than in placebo in the pooled pivotal trials, and was attributed to the study drug by the investigator. And the reviewer stated:

Using that definition, no ADRs would be listed in Section 6 Adverse Reactions section of the package insert. In the opinion of this reviewer, stating that there were no ADRs associated with the investigational drug might mislead health care providers and patients about the risks and benefits associated with taking the investigational drug. Therefore, the adverse events reported in at least 1% of subjects in the pivotal trials will be included in the package insert.

Comments regarding laboratory values, vital signs, ECG, QT, and immunogenicity were related to the presence of trends or abnormal values taking into account the expected changes explainable by the underlying disease. They analyze dose-dependency in relation to change in all those values.

A variety of statistical and epidemiological analyses may be applied here. It is not infrequent to find survival analysis curves applied to time-to-adverse event analysis.

Analysis of submission-specific safety issues

Here reviewers analyze a set of safety concerns that are related to the specific submission. For example, if hepatic toxicity is a concern, they evaluate liver effects. In some cases, those events are considered adverse events of special interest.
Description of clinical cases is something that occurs when a specific safety concern is analyzed.

Safety analysis by demographic subgroups

The purpose of this sub-section is to provide analyses of safety information for demographic interactions. Several methods and analytics may be applied here to explore the effects of possible interactions on safety signals / events. For many applications, individual clinical trials may not be powered enough to reach conclusions regarding safety among the demographic subgroups (age, gender, and race). Pooled analysis, when appropriate, will have greater power, interpretations about subgroup data should be made with caution. Nonetheless, these analyses should be performed when feasible, and tables and graphics should be created. Analysis of adverse events (real world data) by geographic region is also appropriate.

This type of analysis could be placed on Safety analysis section. Sometimes it appears here.
In this section, specific safety analysis and tables by age, gender, and race are presented and discussed. What is important here is if there are safety differences by age groups, sex, or race that could indicate a different safety profile or behavior.

Clinical outcome assessment (COA) analyses informing safety/tolerability

Sometimes, when pertinent, this section is included. For example in case of the application of patient reported outcomes (PRO) instruments. According to one reviewer, “PRO results are not likely to offer unbiased and conclusive evidence of patient’s quality of life.” This statement was probably made because the applicant wanted to include some benefit language in the product label.

Specific safety studies / clinical trials

Reviewers evaluate here if there was a study for the assessment of a specific safety issue, to identify or quantify a particular safety concern.

Additional safety explorations

Typically here human carcinogenicity or tumor development, human reproduction and pregnancy, and pediatrics and assessment of effects on growth are explored here. Moreover, overdose, drug abuse potential, withdrawal and rebound issues are discussed here too.

Safety in the postmarket setting

Sometimes the drug under investigation has some postmarket experience, in some specific countries, for example. That postmarket experience needs to be analyzed y evaluated from the safety point of view. The safety review of postmarket experience centers basically on serious adverse events. The expectations from safety in the post-marketing setting are also stated. In general, routine pharmacovigilance activities are in order.

Additional safety issues from other disciplines

In general, safety issues from other disciplines are discussed in their respective sections of the approval review.

Integrated assessment of safety

I have found a variety of approaches reviewers take to write this section. It goes from a minimalist (and I believe a little off) “The above safety assessment incorporates data from X trials and is therefore integrated”, to a short summary of all the previous sections, to an extended safety assessment of 2-3 pages. It normally determines if there are or not concerning safety findings. It is also stated whether or not the safety issues are correctly communicated in the product label, or determine if the applicant should include any AEs in “Warnings and precautions” section of the product label.

Postmarket commitments like PMR studies or REMS, boxed warnings, and enhanced pharmacovigilance are recommendations made by the reviewers in the integrated assessment of safety.

Conclusions

  • Analysis of the clinical reviews found in the approval packages from recently approved drugs is of great help understanding how review of safety is performed.
  • Read the FDA Clinical Review Template. That will give you an incredible insight on what reviewers are looking for.
  • After reviewing the first 10 reviews of safety, little to no information was added to my analysis by reading the next 10 ones.
  • Reviewers follow the main clinical review outline, but there is a wide variety of approaches to the evaluation of the different aspects and data of the Review of Safety.
  • Many of the subtle differences among the reviews of safety evaluated are product-related. So it would be advisable to review, for example, the 10 latest clinical reviews from approved oncology products if you are submitting an oncology product.
  • There is no mention of statistical analysis in the Review of Safety. Reviewers do a great job with extensive descriptive analysis. This is also helpful to avoid arguments related to applying statistical testing to pooled data.
  • Honest description of our safety data, making use of our current knowledge is generally more than enough to elaborate an appropriate safety profile of our product in our population(s). No rocket science needed.
  • This exercise helped me to obtain responses on what reviewers are looking for and, consequently, better prepare for NDA/BLA submission and success from the safety review perspective.
  • Although this post refers to the review of safety section of the clinical review, this approach can be applied to the rest of documents constituting the submission package for NDA / BLA approval.

Jose Rossello
Jose Rossello

Filed Under: NDA BLA

Mining PubMed for Drug Induced Acute Kidney Injury

March 11, 2019 by Jose Rossello 1 Comment

Enhancing signal detection capabilities beyond regular literature search

Methods and tools for data mining and all its variants, namely text mining and web mining, are emerging at cosmic speeds. But their implementation in pharmacovigilance and pharmacoepidemiology is still on its early stages.

The aim of this post is to explore and apply some of the current methods and tools using PubMed as the primary source for text mining. For this exercise I have chosen to mine PubMed abstracts for drug-induced acute kidney injury.

Searching for abstracts in PubMed

For this purpose, I used the PubMed Advanced Search Builder, which generated this search string: “(drug induced) AND acute kidney injury”, as shown here:

Searching for abstracts in pubmed

If you want to go directly to the results from that search, you can use https://www.ncbi.nlm.nih.gov/pubmed?term=(drug%20induced)%20AND%20acute%20kidney%20injury

At the time of writing this post, there were 8916 results from that search. The next step was to download all the abstracts into a text file, as shown on this screenshot:

Pubmed search results

Mining Abstracts with pubmed.mineR

Obviously, nobody has the time to read all the almost nine thousand abstracts. And if we had the time to do it, we would not have the ability, as human beings, to digest and integrate all this knowledge.

To help us with the task of knowledge discovery, we are going to use some applications in R language for the purpose of mining the text we have extracted. And this is when fun begins.

The R package we will use here is pubmed.mineR. The latest information on this package can be found here. To run the code I have used RStudio.

Package pubmed.mineR has many capabilities, most of them are not shown here. I have identified which of them would be more interesting for pharmacovigilance mining.

The initial code is shown below. In this post, code has a gray background, and the output a light blue background.

It starts by installing the package, and setting up the directory on your computer for input-output. I have used mine, but you will have to change it for your own path. The next step is to call the library.

# Install package:
install.packages(“pubmed.mineR”)
# Set directory:
setwd(“D:/PharmacovigilanceAnalytics.com/pubmed.mineR”)
# Call library(ies)
library(pubmed.mineR)
library(data.table)
# readabs will automatically read the abstracts from the pubmed file (pubmed_result.txt) and will write an S4 object which I named ‘akidrug’
akidrug <- readabs(“pubmed_result.txt”)
# printing first and last abstracts from akidrug:
printabs(akidrug)

The output resulting from ‘printabs(akidrug)’ is here, showing the first and the last abstracts:

Number of Abstracts 8916
Starts with
Renal Damaging Effect Elicited by Bicalutamide Therapy Uncovered Multiple Action Mechanisms As Evidenced by the Cell Model. Peng CC(1), Chen CY(2), Chen CR(3), Chen CJ(2), Shen KH(4)(5), Chen KC(6)(7)(8), Peng RY(9). Author information: (1)Graduate Institute of Clinical Medicine, School of Medicine, College of Medicine, Taipei Medical University, 250 Wu-Hsing Street, Taipei, 11031, Taiwan. (2)Wayland Academy, 101 North University Avenue, Beaver Dam, WI, 53916, USA. (3)International Medical Doctor Program, The Vita-Salute San Raffaele University, Via Olgettina 58, 20132, Milano, Italy. (4)Division of Urology, Department of Surgery, Chi Mei Medical Center, Tainan, 710, Taiwan. (5)Department of Optometry, College of Medicine and Life Science, Chung Hwa University of Medical Technology, Tainan, 717, Taiwan. (6)Graduate Institute of Clinical Medicine, School of Medicine, College of Medicine, Taipei Medical University, 250 Wu-Hsing Street, Taipei, 11031, Taiwan. kuanchou@tmu.edu.tw. (…
ADT-induced hypogonadism was reported to have the potential to lead to acute kidney injury (AKI).
ADT was also shown to induce bladder fibrosis via induction of the transforming growth factor (TGF)-β level.

Ends with
[APROPOS OF 8 CASES OF CARBON TETRACHLORIDE POISONING]. [Article in French] VEREERSTRAETEN P, VERNIORY A, VEREERSTRAETEN J, TOUSSAINT C, VERBANCK M, LAMBERT PP. NA NA

Word atomization

Something we can do is to determine the word frequency. For this purpose, pubmed.mineR uses “word_atomizations”:

akidrug_words <- word_atomizations(akidrug)
# Print the first 10 words by frequency
akidrug_words[1:10,]

The following table shows the first ten most frequent words. As expected, these most frequent words refer to the acute kidney injury aspect of your PubMed search. Please keep into account that word counting is one of the fundamental basis of text mining. Word counting contains still a very important research opportunity. I suggest to analyze, from the list generated by this example, word counts that are not as obvious as “renal”, “kidney”, or “patient” for this specific type of search.

ID NumberWordFrequency
53805renal19824
18468acute9478
40387kidney8584
38691 injury8236
49268 patients7712
53138 rats5519
32372 failure 5451
60217 treatment4861
34861 group4004
60509 tubular3701

Gene atomization

Gene atomization will automatically fetch the genes (HGNC approved Symbol) from the text and report their frequencies.

# If you remember, akidrug is the name of the file for the collection of abstracts. Akidrug_gene will be the collection of genes found in those abstracts
akidrug_gene <- gene_atomization(akidrug)
# Next, we will obtain a subset of akidrug_gene containing 2 variables, one for the gene symbol and the other for the frequency
genes_table <- subset(akidrug_gene, select = c(“Gene_symbol”,”Freq”))
# Next, we prepare the whole gene database. The complete set can be obtained from the HGNC site.
hgnc<-read.delim(“D:/PharmacovigilanceAnalytics.com/pubmed.mineR/hgnc_complete_set.txt”,
header = T,stringsAsFactors = F)

We want to extract sentences containing Alias of the Human Genes, from the PubMed abstracts:

alias_fn(genes_table,hgnc,akidrug,”output”,c(“drug induced”,”acute kidney injury”,”adverse event”))

A sample from the results (saved to “outputalias”) is shown here:

TNF TNF-alpha
C3 C3b
PAH PH
PARP1 PARP
26184635
However, it is still unclear whether PARP overactivation happens during acute kidney injury (AKI) caused by endotoxic shock (ES).

1

And another one:

BAK1 BAK
CD5 T1
CR1 KN
ICAM1 CD54
IL18 IL-18
30531196
Other biomarkers of drug-induced kidney toxicity that have been detected in the urine of rodents or patients include IL-18 (interleukin-18), NGAL (neutrophil gelatinase-associated lipocalin), Netrin-1, liver type fatty acid binding protein (L-FABP), urinary exosomes, and TIMP2 (insulin-like growth factor -binding protein 7)/IGFBP7 (insulin-like growth factor binding protein 7), also known as NephroCheck®, the first FDA-approved biomarker testing platform to detect acute kidney injury (AKI) in patients.

2
  1. 1.
    Liu S, Liu J, Liu D, Wang X, Yang R. Inhibition of Poly-(ADP-Ribose) Polymerase Protects the Kidney in a Canine Model of Endotoxic Shock. Nephron. 2015;130(4):281-292. https://www.ncbi.nlm.nih.gov/pubmed/26184635.
  2. 2.
    Griffin B, Faubel S, Edelstein C. Biomarkers of drug-induced kidney toxicity. Ther Drug Monit. December 2018. https://www.ncbi.nlm.nih.gov/pubmed/30531196.

Literature Curation with PubTator Functionality

PubTator is a Web-based tool for accelerating manual literature curation (e.g. annotating biological entities and their relationships) through the use of advanced text-mining techniques. As an all-in-one system, PubTator provides one-stop service for annotating PubMed citations.

PubMed.mineR has a PubTator function. The PubTator function uses a PMID as entry and delivers results regarding chemicals, diseases, genes, and mutations, if they are referenced in the article. We are going to use the article by Griffin (see article 2 above, PIMD: 30531196) Let’s try it and see what hppens:

# Run PubTator function on PIMD 30531196 and save results on pubtator_output:
pubtator_output <- pubtator_function(30531196)
# Print PubTator output for chemicals, diseases, genes, and mutations:
pubtator_output$Chemicals
pubtator_output$Diseases
pubtator_output$Genes
pubtator_output$Mutations

Results are here:

Literature Curation with PubTator Functionality

There are many other pubmed.mineR functionalities. I encourage the reader to explore them and comment on the comments section of this post.

Exploration of other R packages.
Articles Published by Year and Word Cloud

This section is inspired on the code presented here.

library(RISmed)
library(dplyr)
library(ggplot2)
library(tidytext)
library(wordcloud)
result <- EUtilsSummary(“(drug induced) AND acute kidney injury”,
type = “esearch”,
db = “pubmed”,
datetype = “pdat”,
retmax = 30000,
mindate = 1960,
maxdate = 2019)
fetch <- EUtilsGet(result, type = “efetch”, db = “pubmed”)

abstracts <- data.frame(title = fetch@ArticleTitle,
abstract = fetch@AbstractText,
journal = fetch@Title,
DOI = fetch@PMID,
year = fetch@YearPubmed)
abstracts <- abstracts %>% mutate(abstract = as.character(abstract))
abstracts %>%
head()
abstracts %>%
group_by(year) %>%
count() %>%
filter(year > 1959) %>%
ggplot(aes(year, n)) +
geom_point() +
geom_line() +
labs(title = “Pubmed articles with search terms (drug induced) AND acute kidney injury \n1960-2019″, hjust = 0.5,
y = “Articles”)
cloud <- abstracts %>%
unnest_tokens(word, abstract) %>%
anti_join(stop_words) %>%
count(word, sort = TRUE)
cloud %>%
with(wordcloud(word, n, min.freq = 15, max.words = 500, colors = brewer.pal(8, “Dark2”)), scale = c(8,.3), per.rot = 0.4)

drug-induced acute kidney injury
word cloud for drug-induced acute kidney injury

This is the first of a series of posts analyzing text mining applications for PubMed. The second one explores knowledge graphs and semantic analytics.

Jose Rossello
Jose Rossello

Filed Under: Text Mining Tagged With: acute kidney injury, pharmacovigilance mining, pubmed, text mining, web mining

Top 7 Predictive Model Applications in Drug Safety and Pharmacovigilance

February 24, 2019 by Jose Rossello 5 Comments

As drug safety and pharmacovigilance organizations develop more sophisticated data analytics capabilities, they are starting to move from basic descriptive analysis towards predictive analysis and the development of predictive models. Predictive analytics uses existing information to make predictions of future outcomes or future trends in all areas of Medicine and Health Care1.

The importance of being one step ahead of (adverse) events is most clearly seen in the framework of signal detection, and of the identification and characterization of individuals with a specific risk for developing an adverse event after the exposure to a medicine, both in clinical development2,3 and in post-marketing settings4.

Identification of risks from spontaneous reports

Predictive modeling can be used for the identification of previously unrecognized risks of medicines in pharmacovigilance reports. A nice example of this use is VigiRank, a data-driven predictive model for emerging safety signals, which has been shown to outperform disproportionality analysis alone in real world pharmacovigilance signal detection5. VigiRank is to be applied in VigiBase, in which predictive models have been proven useful to detect safety signals that were eventually validated, in pediatric populations.6

Evaluation of unexpected increase in reporting frequency

Similarly, the European Medicines Agency developed an algorithm to detect unexpected increases in frequencies of reports, in particular quality defects, medication errors, and cases of abuse or misuse. The algorithm applied to the EudraVigilance database showed encouraging results7.

Risk prediction of adverse experiences after exposure to a drug

Predictive models have been also used to predict the relationship between exposure to an investigational medicinal product and the risk of adverse events. For example, Niebecker8 characterized the relationship between exposure to afatinib and diarrhea and rash/acne adverse event trajectories, with the final goal of developing a modeling framework to allow prospective comparison of dosing strategies and study designs with respect to safety. In another other example, predictive models have been used for the prediction of adverse reactions after administration of rituximab in patients with hematologic malignancies9.

Different approaches to predictive analysis have been taken, depending on the specific machine learning tool applied. Machine learning has been used to predict the probability of adverse event occurrence at the time of drug prescribing, using a neural network model.10

Predictive models in clinical development and postmarket signal detection

Other authors developed a model to quantify whether safety signals observed in first-in-human studies were likely the result of chance or the compound under investigation. The model quantifies how likely an event is due to chance, conditionally on the characteristics of the subject and the study11.

The combination of different predictive modeling techniques like random forest, L1 regularized logistic regression, support vector machine, and neural models were successfully applied to detect signals arising from laboratory-event-related adverse drug reactions. The authors combined features from each of the modeling techniques into a machine learning model. The application of this model to an electronic health record environment was considered satisfactory for signal detection purposes12.

Supervised machine learning signal detection methods have been tested for the identification of adverse drug reactions. In the world of medication dispensing data, sequence symmetry analysis (SSA) has been used to detect signals of adverse drug reactions. This precise study shows how a gradient boost classifier complements well SSA13.

Specific subpopulations like hospitalized patients

Predictive analysis and model development shows interesting uses in the evaluation of risks as in this case, where the authors used mathematical models to determine the probability of adverse drug experiences in the surgical setting at the time of hospital admission, identifying the patients that are at a higher risk of an adverse drug experience during the hospital stay14. In another study focused on drug safety in hospitals, the authors perform a systematic review of predictive risk models for adverse drug events during hospitalization15.

Prediction of hepatotoxicity and interactions

To predict drug-induced hepatotoxicity based on gene expression and toxicology data, by means of a multi-dose computational model16.

Use of predictive models for the prediction of adverse drug reactions induced by drug-drug interactions17.

Predictive models for comparative safety

Leonard CE et al. utilized a Cox proportional hazard model to identify comparative safety differences among 3 sulfonylureas and the risk of sudden cardiac arrest and ventricular arrhythmia18.

  1. 1.
    Alanazi H, Abdullah A, Qureshi K. A Critical Review for Developing Accurate and Dynamic Predictive Models Using Machine Learning Methods in Medicine and Health Care. J Med Syst. 2017;41(4):69. https://www.ncbi.nlm.nih.gov/pubmed/28285459.
  2. 2.
    Federer C, Yoo M, Tan A. Big Data Mining and Adverse Event Pattern Analysis in Clinical Drug Trials. Assay Drug Dev Technol. 2016;14(10):557-566. https://www.ncbi.nlm.nih.gov/pubmed/27631620.
  3. 3.
    Poleksic A, Xie L. Predicting serious rare adverse reactions of novel chemicals. Bioinformatics. 2018;34(16):2835-2842. https://www.ncbi.nlm.nih.gov/pubmed/29617731.
  4. 4.
    Ventola C. Big Data and Pharmacovigilance: Data Mining for Adverse Drug Events and Interactions. P T. 2018;43(6):340-351. https://www.ncbi.nlm.nih.gov/pubmed/29896033.
  5. 5.
    Caster O, Sandberg L, Bergvall T, Watson S, Norén G. vigiRank for statistical signal detection in pharmacovigilance: First results from prospective real-world use. Pharmacoepidemiol Drug Saf. 2017;26(8):1006-1010. https://www.ncbi.nlm.nih.gov/pubmed/28653790.
  6. 6.
    Star K, Sandberg L, Bergvall T, Choonara I, Caduff-Janosa P, Edwards I. Paediatric safety signals identified in VigiBase: Methods and results from Uppsala Monitoring Centre. Pharmacoepidemiol Drug Saf. February 2019. https://www.ncbi.nlm.nih.gov/pubmed/30767342.
  7. 7.
    Pinheiro L, Candore G, Zaccaria C, Slattery J, Arlett P. An algorithm to detect unexpected increases in frequency of reports of adverse events in EudraVigilance. Pharmacoepidemiol Drug Saf. 2018;27(1):38-45. https://www.ncbi.nlm.nih.gov/pubmed/29143393.
  8. 8.
    Niebecker R, Maas H, Staab A, Freiwald M, Karlsson M. Modelling Exposure-Driven Adverse Event Time Courses in Oncology Exemplified by Afatinib. CPT Pharmacometrics Syst Pharmacol. January 2019. https://www.ncbi.nlm.nih.gov/pubmed/30681293.
  9. 9.
    D’Arena G, Simeon V, Laurenti L, et al. Adverse drug reactions after intravenous rituximab infusion are more common in hematologic malignancies than in autoimmune disorders and can be predicted by the combination of few clinical and laboratory parameters: results from a retrospective, multicenter study of 374 patients. Leuk Lymphoma. 2017;58(11):2633-2641. https://www.ncbi.nlm.nih.gov/pubmed/28367662.
  10. 10.
    Kasatkin D, Bogomolov Y, Spirin N. [Steps to personalized therapy of multiple sclerosis: predicting safety of treatment using mathematical modeling]. Zh Nevrol Psikhiatr Im S S Korsakova. 2018;118(8. Vyp. 2):70-76. https://www.ncbi.nlm.nih.gov/pubmed/30160671.
  11. 11.
    Clayton G, Schachter A, Magnusson B, Li Y, Colin L. How Often Do Safety Signals Occur by Chance in First-in-Human Trials? Clin Transl Sci. 2018;11(5):471-476. https://www.ncbi.nlm.nih.gov/pubmed/29702733.
  12. 12.
    Jeong E, Park N, Choi Y, Park R, Yoon D. Machine learning model combining features from algorithms with different analytical methodologies to detect laboratory-event-related adverse drug reaction signals. PLoS One. 2018;13(11):e0207749. https://www.ncbi.nlm.nih.gov/pubmed/30462745.
  13. 13.
    Hoang T, Liu J, Roughead E, Pratt N, Li J. Supervised signal detection for adverse drug reactions in medication dispensing data. Comput Methods Programs Biomed. 2018;161:25-38. https://www.ncbi.nlm.nih.gov/pubmed/29852965.
  14. 14.
    Bos J, Kalkman G, Groenewoud H, et al. Prediction of clinically relevant adverse drug events in surgical patients. PLoS One. 2018;13(8):e0201645. https://www.ncbi.nlm.nih.gov/pubmed/30138343.
  15. 15.
    Falconer N, Barras M, Cottrell N. Systematic review of predictive risk models for adverse drug events in hospitalized patients. Br J Clin Pharmacol. 2018;84(5):846-864. https://www.ncbi.nlm.nih.gov/pubmed/29337387.
  16. 16.
    Su R, Wu H, Xu B, Liu X, Wei L. Developing a Multi-Dose Computational Model for Drug-induced Hepatotoxicity Prediction based on Toxicogenomics Data. IEEE/ACM Trans Comput Biol Bioinform. July 2018. https://www.ncbi.nlm.nih.gov/pubmed/30040651.
  17. 17.
    Liu R, AbdulHameed M, Kumar K, Yu X, Wallqvist A, Reifman J. Data-driven prediction of adverse drug reactions induced by drug-drug interactions. BMC Pharmacol Toxicol. 2017;18(1):44. https://www.ncbi.nlm.nih.gov/pubmed/28595649.
  18. 18.
    Leonard C, Brensinger C, Aquilante C, et al. Comparative Safety of Sulfonylureas and the Risk of Sudden Cardiac Arrest and Ventricular Arrhythmia. Diabetes Care. 2018;41(4):713-722. https://www.ncbi.nlm.nih.gov/pubmed/29437823.
Jose Rossello
Jose Rossello

Filed Under: Predictive Analytics

The Pharmacovigilance of the Future: Prospective, Proactive, and Predictive

April 6, 2018 by Jose Rossello 3 Comments

Peter J Pitts, President of the Center for Medicine in the Public Interest, and Hervé Le Louet, President of CIOMS, have just published an intellectually-stimulating essay on the future of pharmacovigilance entitled “Advancing Drug Safety Through Prospective Pharmacovigilance“. The complete reference of the article is: Pitts PJ, Le Louet H. Ther Innov Regul Sci 2018; https://doi.org/10.1177/2168479018766887.

First, the authors point out that we are entering a new era in drug development. To support that statement, they refer to how the FDA is transforming its way of thinking. On the FDA guidelines on collaborative approach for drug development for pediatric rare diseases, the agency proposes new design types for rare diseases, utilizing the example of Gaucher disease. The proposed study design features include: double-blind, controlled, randomized, multi-center, multi-arm, multi-company noninferiority or superiority trial to evaluate the efficacy and safety of product A, B, C…

Other innovative approaches found in the FDA guideline are those related to the use of modeling and simulation to optimize pediatric studies, as for example to predict the effect of a drug in children based on previously known performance in adults, particularly to inform the dosing rationale.

Small frequency of the disease or the outcome under study should never be an excuse for the weaknesses of a study design. As we were taught when studying Epidemiology, if you don’t have enough cases in your center, then you should try a multi-center study. Now, the next frontier is, not only multi-center studies, but multi-company studies.

The pharmacovigilance paradigm is changing and evolving very fast, keeping up with all the new developments in artificial intelligence (AI), the analysis of real world data to obtain real world evidence, and the multiple, really diverse sources of safety information that are available today. According to the authors:

Artificial intelligence will facilitate what the pharmacovigilance ecosystem lacks today – coordinated and efficient systems for developing actionable evidence on safety and effectiveness

The field of artificial intelligence is evolving so rapidly, that I’m convinced we will pretty soon face the paradox of needing AI help for human intelligence to understand what AI is delivering.

To me, the most important point of this paper relies on the subtle comparison between what I would call the ‘old’ pharmacovigilance, which is reactive and non-anticipatory, and the ‘new’ pharmacovigilance, which is proactive in continuously evaluating the benefit-risk profile of a product, elaborating predictive models giving place to predictive pharmacovigilance.

I cannot finish my review without mentioning the most interesting and intriguing section of the paper “Inventing the Pharmacovigilance Future“. In this section, the authors present brilliant ideas they very probably can help to put into practice. I would like to highlight their suggestion of “an international effort under the tripartite chairmanship of the WHO, the ICH, and the CIOMS, to investigate, debate and develop prototype programs for drugs approved via expedited review pathways, based on more sensitive premarket metrics of risk pontential”. And the last, and most intriguing of the concepts presented in this paper, is the Real World Pharmacovigilance Score (RWPS), a baseline prediction of likely adverse events based on projected volume and specific clinical use. Many questions I have about RWPS are not responded in the paper: how is it calculated, do you have any example of application in ‘real world’? I wish they will publish a paper on this matter.

I recommend you to read the essay, eye opening and intellectually challenging.

Jose Rossello
Jose Rossello

Filed Under: News Tagged With: artificial intelligence, predictive pharmacovigilance, real world data

Disproportional Recording vs Disproportional Reporting

April 1, 2018 by Jose Rossello Leave a Comment

Signals of Disproportional Recording – Seriously?

I have read with great interest a paper recently published in Drug Safety journal (Zhou X, Douglas IJ, Shen R, Bate A. Signal Detection for Recently Approved Products: Adapting and Evaluating Self-Controlled Case Series Method Using a US Claims and UK Electronic Medical Records Database. Drug Saf. https://doi.org/10.1007/s40264-017-0626-y). As always, I read with attention all papers authored by Andrew Bate and his team.

Something in the paper that called my attention was the concept of “Signals of Disproportional Recording (SDRs)“. I read it first in the abstract, and my first thought was that it was an error, and the authors were actually referring to Signals of Disproportionate Reporting (SDRs). Signals of disproportionate reporting are understood as statistical associations between medicinal products and adverse events i.e. drug-event pairs. When a SDR is identified for a medicinal product, this adverse event is reported relatively more frequently in association with this medicinal product than with other medicinal products (Practical Aspects of Signal Detection in Pharmacovigilance : Report of CIOMS Working Group VIII. CIOMS, Geneva, 2010).

Of course, it was not a mistake. The Analysis Methods section of the paper explains it clearly:

Incidence rate ratios (IRRs) are calculated by comparing the rate of events in a given post-exposure period (risk period) with the rate of events in unexposed periods absent of the exposure (all other observed times). In a signal screening framework, statistical uncertainty is examined based on the 95% confidence interval (CI) of the IRR estimates. Specifically, when the lower bound of the 95% CI of the IRR estimate is > 1, this is considered a positive finding and is a Signal of Disproportional Recording (SDR) analogous to SDRs in spontaneous reporting, which are findings of potential interest that have not undergone clinical review to be considered signals of suspected causality.

But I wanted to know more about this new concept. Who was the first one to use it on a scientific communication? I did a little research and found one reference for the same concept: A. Bate. Tuning Epidemiological Study Design Methods for Exploratory Data Analysis in Real World Data. Abstract presented in 15th ISOP Annual Meeting “Cubism in Pharmacovigilance” Prague, Czech Republic 27-30 October, 2015.

So, it is clear that the concept of signal of disproportional recording has been first used by Andrew Bate. The concept is brilliant. The finding of an adverse event-drug pair in an electronic health record happens because someone recorded it, independently of whether or not is was also reported.

Even though secondary use of electronic healthcare records (EHR) and insurance claims data for hypothesis testing has occurred for many decades, signal detection activities to identify potential drug safety issues has historically focused primarily on spontaneous reports. But there is an increasing interest on using EHR for signal detection in pharmacovigilance. Electronic health records exhibit special characteristics (longitudinal nature, partially unstructured data) that is requiring to adapt old analytics to this new framework, and even create new methods and concepts (Zorych I, Madigan D, Ryan P, Bates A. Disproportionality methods for pharmacovigilance in longitudinal observational databases. Stat Methods Med Res 2013; 22(1):39-56). That is, the analytic techniques used for the analysis of drug-event (or drug-outcome) pairs in spontaneous reporting of adverse events, are not directly applicable to EHR and claims data. Creative thinking and new research are welcome in this area.

The paper is interesting, not only for using “disproportional recording”, which is anecdotal. It explores how to adapt and evaluate the self-controlled case series method and its use in claims and electronic medical records databases, for the challenging aspect of signal detection in the framework of  recently approved products. You will find an interesting discussion on the appropriate risk period selection method, which may be different in drug safety signal detection, than in formal hypothesis-testing studies.

The authors conclude that self-controlled case series method may be useful for safety signal detection in EHRs, and that early identification of previously unknown safety signals may be possible shortly after a new product is launched. Performance of this method varies by the nature of both exposure and event pair and their anticipated association.


Jose Rossello
Jose Rossello

Filed Under: Signal Detection Tagged With: disproportional recording, disproportional reporting, SDR, signal detection

Deep Learning, Machine Learning, and Artificial Intelligence – What are the Differences?

March 18, 2018 by Jose Rossello 1 Comment

In this video, Bernardo F. Nunes explains how these 3 concepts (artificial intelligence, machine learning, and deep learning) do not represent the same thing:

Bernardo is breaking down the 3 concepts for us, in a very easy and understandable way.

Artificial intelligence exists when a machine has cognitive capabilities, such as problem solving and learning. It’s normally associated to a human benchmark, as, for example reasoning, speech, and vision.

In the video, he differentiates 3 levels of A.I.:

  1. Narrow A.I., when a machine is better than us in a specific task (we are here now)
  2. General A.I., when a machine is like us in any intellectual task
  3. Strong A.I, when a machine is better than us in many tasks

One of the favorites early developments in A.I. is the perceptron (1957). It was a single layer of artificial neural networks designed for image recognition. They are called neural networks because the first practitioners on A.I. thought that these interconnected nodes looked like the human neural system, which has neural networks. These are the natural neural networks. The perceptron is a rudimentary version of an artificial neural network.

Machine learning, appeared on the 1980s, when a body of researchers worked on what is called supervised learning. Algorithms are trained with datasets based on past examples, in a model in which the trained algorithm is applied to a new dataset for classification purposes. Widely used for business purposes.

Deep learning makes use of deep neural networks. Shallow neural nets have only one hidden layer between the input and the output. However, deep neural nets have 2 or more hidden layers between the input and the output. It’s the responsible for the advancement in image recognition. If you can represent an image numerically, then you can process it with deep learning.

Bernardo’s conclusion is that deep learning, machine learning, and artificial intelligence are not 3 different things. They simply are subsamples of each other: deep learning belongs to machine learning, and machine learning belongs to artificial intelligence.

Jose Rossello
Jose Rossello

Filed Under: PV Analytics Tagged With: AI, artificial intelligence, deep learning, machine learning

How Organizations Use Social Media For Pharmacovigilance

March 7, 2018 by Jose Rossello 2 Comments

Pharmacovigilance and Social Media – are you there yet?

In this lecture, Alexandra Hoegberg from the Uppsala Monitoring Centre gives an interesting lecture about the role of social media in public health, particularly in pharmacovigilance. After listening to the lecture, I would have better used ‘drug safety’ instead of ‘pharmacovigilance’ in the title.

Social media channels are becoming an effective communication tool which can be used to expand reach, foster engagement, and increase access to credible, science-based health messages.

Bottom line is that it informs the public and has the potential to empower people to make safer health decisions

OK, that’s unidirectional, from institutions and official bodies to individuals / patients. But how about from individuals to institutions? In pharmacovigilance and drug safety we are interested in both sides of the equation.

The lecturer provides examples of how MHRA uses social media to reach and provide information to the population on side effects of certain drugs.

She makes good points on potential pitfalls of the use of social media from health organizations, and the possibility of having to deal with fake news that spread virally.

As an example of fake news, the lecturer mentions the case published on The Independent (7 Jan 2017):

Revealed: How Dangerous Fake Health News Conquered Facebook:

The widespread circulation of fake health news on social networks is misleading and potentially dangerous, health officials have warned.

Misinformation published by conspiracy sites about serious health conditions is often shared more widely than evidence-based reports from reputable news organisations, according to analysis by The Independent. Of the 20 most-shared articles on Facebook in 2016 with the word “cancer” in the headline, more than half report claims discredited by doctors and health authorities or – in the case of the year’s top story – directly by the source cited in the article.

Facebook has introduced measures allowing users to flag disputed news shared on the site following concerns the circulation of deliberately fictitious articles could have influenced the US election.

Public Health England and the head of the Royal College of GPs have expressed concern over the amount of made-up health news shared online, with Cancer Research UK calling for “vital” action from the social network.

Organizations must set a social media strategy and think about:

  • the purpose of their presence on social media
  • the differences among social media platforms, which ones are more used in your country, and set the tone accordingly
  • which audiences are more likely to use the platform

The lecture finalizes giving valuable tips on what organizations have to do in order to succeed in social media.

This is a good presentation on how institutions and organizations are going to use or should utilize social media. Individual companies in the pharma industry can benefit from this approach too.

Jose Rossello
Jose Rossello

Filed Under: Social Media

Twitter, Safety and Pharmacovigilance: All Papers Retrieved using PubMed

March 2, 2018 by Jose Rossello Leave a Comment

Researchers are increasingly using Twitter to analyze what people are talking about at a given time point and over time. Among the multiple uses analysis of tweets can have, safety surveillance, signal detection and discovery of adverse drug events or adverse drug reactions is something that we are just starting to explore for pharmacovigilance analytics, in the framework of social media analysis.

In this post, we are going to analyze all papers retrieved from PubMed with the search string: twitter AND (safety OR pharmacovigilance). On 02 March 2018, that search resulted in 79 search results. From them, we have hand-picked those related to the use of Twitter for drug safety / pharmacovigilance surveillance purposes. Of course there are other keyword combinations that will provide different results as, for example, “social media data/mining/monitoring”,”adverse drug reaction”, “adverse event”, and others. These other results will be covered by other posts in this series.

This is our selection in chronological order:

Bian J, Topaloglu U, Yu F. Towards Large-scale Twitter Mining for Drug-related Adverse Events. SHB12 2012;25-32.

The increasing popularity of social media platforms like Twitter presents a new information source for finding potential adverse events. Given the high frequency of user updates, mining Twitter messages can lead us to real-time pharmacovigilance.  In this paper, the authors describe an approach to find drug users and potential adverse events by analyzing the content of twitter messages utilizing Natural Language Processing (NLP) and to build Support Vector Machine (SVM) classifiers. Due to the size nature of the dataset (i.e., 2 billion Tweets), the experiments were conducted on a High Performance Computing (HPC) platform using MapReduce, which exhibits the trend of big data analytics. The results suggest that daily-life social networking data could help early detection of important patient safety issues.

Chary M, Genes N, McKenzie A, Manini AF. Leveraging Social Networks for Toxicovigilance. J Med Toxicol 2013;9(2):184-91.

The authors talk about the changing landscape of drug abuse, and that traditional means of characterizing the change are not sufficient any more, because they can miss changes in usage patterns of emerging new drugs. The objective of this paper is to introduce tools for using data from social networks to characterize drug abuse. The authors outline a structured approach to analyze social media in order to capture emerging trends in drug abuse. An analysis of social media discussions about drug abuse patterns with computational linguistics, graph theory, and agent-based modeling permits the real-time monitoring and characterization of trends of drugs of abuse. These tools provide a powerful complement to existing methods of toxicovigilance.

O’Connor K, Pimpalkhute P, Nikfarjam A, Ginn R, Smith KL, Gonzalez G. Pharmacovigilance or Twitter? Mining Tweets for Adverse Drug Reactions. AMIA Annu Symp Proc 2014;924-33.

Recent research has shown that Twitter data analytics can have broad implications on public health research. However, its value for pharmacovigilance has been scantly studied – with health related forums and community support groups preferred for the task. The authors present a systematic study of tweets collected for 74 drugs to assess their value as sources of potential signals for adverse drug reactions (ADRs). They created an annotated corpus of 10,822 tweets. Each tweet was annotated for the presence or absence of ADR mentions, with the span and Unified Medical Language System (UMLS) concept ID noted for each ADR present. Using Cohen’s kappa1, we calculated the inter-annotator agreement (IAA) for the binary annotations to be 0.69. To demonstrate the utility of the corpus, we attempted a lexicon-based approach for concept extraction, with promising success (54.1% precision, 62.1% recall, and 57.8% F-measure). A subset of the corpus is freely available at: http://diego.asu.edu/downloads.

Freifeld CC, Brownstein JS, Benone CM, Bao W, Filice R, Kass-Hout T, et al. Digital Drug Safety Surveillance: Monitoring Pharmaceutical Products in Twitter. Drug Saf 2014;37(5):343-50.

Traditional adverse event (AE) reporting systems have been slow in adapting to online AE reporting from patients. In the meantime, increasing numbers of patients have turned to social media to share their experiences with drugs, medical devices, and vaccines. The aim of this study was to evaluate the level of concordance between Twitter posts mentioning AE-like reactions and spontaneous reports received by a regulatory agency. The authors collected public English-language Twitter posts mentioning 23 medical products from 1 November 2012 through 31 May 2013. Data were filtered using a semi-automated process to identify posts with resemblance to AEs (Proto-AEs). A dictionary was developed to translate Internet vernacular to a standardized regulatory ontology for analysis (MedDRA(®)). Aggregated frequency of identified product-event pairs was then compared with data from the public FDA Adverse Event Reporting System (FAERS) by System Organ Class (SOC). Of the 6.9 million Twitter posts collected, 4,401 Proto-AEs were identified out of 60,000 examined. Automated, dictionary-based symptom classification had 86 % recall and 72 % precision [corrected]. Similar overall distribution profiles were observed, with Spearman rank correlation rho of 0.75 (p < 0.0001) between Proto-AEs reported in Twitter and FAERS by SOC. In conclusion, patients reporting AEs on Twitter showed a range of sophistication when describing their experience. Despite the public availability of these data, their appropriate role in pharmacovigilance has not been established. Additional work is needed to improve data acquisition and automation.

Carbonell P, Mayer MA, Bravo A. Exploring Brand-name Drug Mentions on Twitter for Pharmacovigilance. Stud Health Technol Inform 2015;210:55-9.

Twitter has been proposed by several studies as a means to track public health trends such as influenza and Ebola outbreaks by analyzing user messages in order to measure different population features and interests. In this work the authors analyze the number and features of mentions on Twitter of drug brand names in order to explore the potential usefulness of the automated detection of drug side effects and drug-drug interactions on social media platforms such as Twitter. This information can be used for the development of predictive models for drug toxicity, drug-drug interactions or drug resistance. Taking into account the large number of drug brand mentions that we found on Twitter, it is promising as a tool for the detection, understanding and monitoring the way people manage prescribed drugs.

Patel R, Chang T, Greysen SR, Chopra V. Social Media Use in Chronic Disease: A Systematic Review and Novel Taxonomy. Am J Med 2015;128(12):1335-50.

The authors aimed to evaluate clinical outcomes from applications of contemporary social media in chronic disease; to develop a conceptual taxonomy to categorize, summarize, and then analyze the current evidence base; and to suggest a framework for future studies on this topic. They performed a systematic review of MEDLINE via PubMed (January 2000 to January 2015) of studies reporting clinical outcomes on leading contemporary social media (ie, Facebook, Twitter, Wikipedia, YouTube) use in 10 chronic diseases. Of 378 citations identified, 42 studies examining the use of Facebook (n = 16), blogs (n = 13), Twitter (n = 8), wikis (n = 5), and YouTube (n = 4) on outcomes in cancer (n = 14), depression (n = 13), obesity (n = 9), diabetes (n = 4), heart disease (n = 3), stroke (n = 2), and chronic lower respiratory tract infection (n = 1) were included. Studies were classified as support (n = 16), patient education (n = 10), disease modification (n = 6), disease management (n = 5), and diagnosis (n = 5) within our taxonomy. The overall impact of social media on chronic disease was variable, with 48% of studies indicating benefit, 45% neutral or undefined, and 7% suggesting harm. Among studies that showed benefit, 85% used either Facebook or blogs, and 40% were based within the domain of support. The authors concluded that using social media to provide social, emotional, or experiential support in chronic disease, especially with Facebook and blogs, appears most likely to improve patient care.

Coloma PM, Becker B, Sturkenboom MC, van Mulligen EM, Kors JA. Evaluating Social Media Networks in Medicines Safety Surveillance: Two Case Studies. Drug Saf 2015;38(10):921-30.

There is growing interest in whether social media can capture patient-generated information relevant for medicines safety surveillance that cannot be found in traditional sources. The aim of this study was to evaluate the potential contribution of mining social media networks for medicines safety surveillance using the following associations as case studies: (1) rosiglitazone and cardiovascular events (i.e. stroke and myocardial infarction); and (2) human papilloma virus (HPV) vaccine and infertility. The authors collected publicly accessible, English-language posts on Facebook, Google+, and Twitter until September 2014. Data were queried for co-occurrence of keywords related to the drug/vaccine and event of interest within a post. Messages were analysed with respect to geographical distribution, context, linking to other web content, and author’s assertion regarding the supposed association. A total of 2537 posts related to rosiglitazone/cardiovascular events and 2236 posts related to HPV vaccine/infertility were retrieved, with the majority of posts representing data from Twitter (98 and 85%, respectively) and originating from users in the US. Approximately 21% of rosiglitazone-related posts and 84% of HPV vaccine-related posts referenced other web pages, mostly news items, law firms’ websites, or blogs. Assertion analysis predominantly showed affirmation of the association of rosiglitazone/cardiovascular events (72%; n = 1821) and of HPV vaccine/infertility (79%; n = 1758). Only ten posts described personal accounts of rosiglitazone/cardiovascular adverse event experiences, and nine posts described HPV vaccine problems related to infertility. The authors concluded that publicly available data from the considered social media networks were sparse and largely untraceable for the purpose of providing early clues of safety concerns regarding the prespecified case studies. Further research investigating other case studies and exploring other social media platforms are necessary to further characterise the usefulness of social media for safety surveillance.

Alvaro N, Conway M, Doan S, Lofi C, Overington J, Collier N. Crowdsourcing Twitter Annotations to Identify First-hand Experiences of Prescription Drug Use. J Biomed Inform 2015:58:280-7.

Self-reported patient data has been shown to be a valuable knowledge source for post-market pharmacovigilance. In this paper the authors propose using Twitter to gather evidence about adverse drug reactions (ADRs) after firstly having identified micro-blog messages (also know as “tweets”) that report first-hand experience. In order to achieve this goal, they explore machine learning with data crowdsourced from laymen annotators. With the help of lay annotators recruited from CrowdFlower they manually annotated 1548 tweets containing keywords related to two kinds of drugs: SSRIs (eg. Paroxetine), and cognitive enhancers (eg. Ritalin). Results show that inter-annotator agreement (Fleiss’ kappa) for crowdsourcing ranks in moderate agreement with a pair of experienced annotators (Spearman’s Rho=0.471). Authors utilized the gold standard annotations from CrowdFlower for automatically training a range of supervised machine learning models to recognize first-hand experience. F-Score values are reported for 6 of these techniques with the Bayesian Generalized Linear Model being the best (F-Score=0.64 and Informedness=0.43) when combined with a selected set of features obtained by using information gain criteria.
For the task of selecting ADR data on the crowdsourced annotations Bayesian Generalized Linear Model (BGLM) was observed to be the model providing the overall highest F-Score among those tested, only surpassed by C50 when using the top 50% and the 100% of the features, although in terms of Informedness BGLM obtained the best scores all the time.

Nakhasi A, Bell SG, Passarella RJ, Paul MG, Dredze M, Pronovost PJ. The Potential of Twitter as a Data Source for Patient Safety. J Patient Saf 2016; DOI: 10.1097/PTS.0000000000000253.

Error-reporting systems are widely regarded as critical components to improving patient safety, yet current systems do not effectively engage patients. The authors sought to assess Twitter as a source to gather patient perspective on errors in this feasibility study. They included publicly accessible tweets in English from any geography. To collect patient safety tweets, they authors consulted a patient safety expert and constructed a set of highly relevant phrases, such as “doctor screwed up.” then they used Twitter‘s search application program interface from January to August 2012 to identify tweets that matched the set of phrases. Two researchers used criteria to independently review tweets and choose those relevant to patient safety; a third reviewer resolved discrepancies. Variables included source and sex of tweeter, source and type of error, emotional response, and mention of litigation. Of 1006 tweets analyzed, 839 (83%) identified the type of error: 26% of which were procedural errors, 23% were medication errors, 23% were diagnostic errors, and 14% were surgical errors. A total of 850 (84%) identified a tweet source, 90% of which were by the patient and 9% by a family member. A total of 519 (52%) identified an emotional response, 47% of which expressed anger or frustration, 21% expressed humor or sarcasm, and 14% expressed sadness or grief. Of the tweets, 6.3% mentioned an intent to pursue malpractice litigation. The authors concluded that Twitter is a relevant data source to obtain the patient perspective on medical errors. Twitter may provide an opportunity for health systems and providers to identify and communicate with patients who have experienced a medical error. Further research is needed to assess the reliability of the data.

Powell GE, Seifert HA, Reblin T, Burstein PJ, Blowers J, Menius JA, et al. Social Media Listening for Routine Post-Marketing Safety Surveillance. Drug Saf 2016;39(5):443-54.

Limitations of classical data sources for post-market surveillance include potential under-reporting, lack of geographic diversity, and time lag between event occurrence and discovery. There is growing interest in exploring the use of social media (‘social listening‘) to supplement established approaches for pharmacovigilance. Although social listening is commonly used for commercial purposes, there are only anecdotal reports of its use in pharmacovigilance. Health information posted online by patients is often publicly available, representing an untapped source of post-marketing safety data that could supplement data from existing sources. The objective of this paper is to describe one methodology that could help unlock the potential of social media for safety surveillance. A third-party vendor acquired 24 months of publicly available Facebook and Twitter data, then processed the data by standardizing drug names and vernacular symptoms, removing duplicates and noise, masking personally identifiable information, and adding supplemental data to facilitate the review process. The resulting dataset was analyzed for safety and benefit information. In Twitter, a total of 6,441,679 Medical Dictionary for Regulatory Activities (MedDRA(®)) Preferred Terms (PTs) representing 702 individual PTs were discussed in the same post as a drug compared with 15,650,108 total PTs representing 946 individual PTs in Facebook. Further analysis revealed that 26 % of posts also contained benefit information. Authors concluded that social media listening is an important tool to augment post-marketing safety surveillance. Much work remains to determine best practices for using this rapidly evolving data source.

Adrover C, Bodnar T, Huang Z, Telenti A, Salathe M. Identifying Adverse Effects of HIV Drug Treatment and Associated Sentiments Using Twitter. JMIR Public Health Surveill 2015 Jul 27;1(2):e7. doi: 10.2196/publichealth.4488.

Social media platforms are increasingly seen as a source of data on a wide range of health issues. Twitter is of particular interest for public health surveillance because of its public nature. However, the very public nature of social media platforms such as Twitter may act as a barrier to public health surveillance, as people may be reluctant to publicly disclose information about their health. This is of particular concern in the context of diseases that are associated with a certain degree of stigma, such as HIV/AIDS. The objective of the study was to assess whether adverse effects of HIV drug treatment and associated sentiments can be determined using publicly available data from social media. The authors describe a combined approach of machine learning and crowdsourced human assessment to identify adverse effects of HIV drug treatment solely on individual reports posted publicly on Twitter. Starting from a large dataset of 40 million tweets collected over three years, we identify a very small subset (1642; 0.004%) of individual reports describing personal experiences with HIV drug treatment. Despite the small size of the extracted final dataset, the summary representation of adverse effects attributed to specific drugs, or drug combinations, accurately captures well-recognized toxicities. In addition, the data allowed us to discriminate across specific drug compounds, to identify preferred drugs over time, and to capture novel events such as the availability of preexposure prophylaxis. The authors conclude that the effect of limited data sharing due to the public nature of the data can be partially offset by the large number of people sharing data in the first place, an observation that may play a key role in digital epidemiology in general.

Korkcontzelos I, Nikfarjam A, Shardlow M, Sarker A, Ananiadou S, Gonzalez GH. Analysis of the Effect of Sentiment Analysis on Extracting Adverse Drug Reactions from Tweets and Forum Posts. J Biomed Inform 2016;62:148-68.

Based on the intuition that patients post about Adverse Drug Reactions (ADRs) expressing negative sentiments, the authors investigated the effect of sentiment analysis features in locating ADR mentions. To achieve that, the authors enriched the feature space of a state-of-the-art ADR identification method with sentiment analysis features. Using a corpus of posts from the DailyStrength forum and tweets annotated for ADR and indication mentions, they evaluated the extent to which sentiment analysis features help in locating ADR mentions and distinguishing them from indication mentions. Evaluation results show that sentiment analysis features marginally improve ADR identification in tweets and health related forum posts. Adding sentiment analysis features achieved a statistically significant F-measure increase from 72.14% to 73.22% in the Twitter part of an existing corpus using its original train/test split. Using stratified 10×10-fold cross-validation, statistically significant F-measure increases were shown in the DailyStrength part of the corpus, from 79.57% to 80.14%, and in the Twitter part of the corpus, from 66.91% to 69.16%. Moreover, sentiment analysis features are shown to reduce the number of ADRs being recognized as indications. In conclusion, this study shows that adding sentiment analysis features can marginally improve the performance of even a state-of-the-art ADR identification method. This improvement can be of use to pharmacovigilance practice, due to the rapidly increasing popularity of social media and health forums.

Liu J, Zhao S, Zhang X. An Ensemble Method for Extracting Adverse Drug Events from Social Media. Artif Intell Med 2016;70:62-76.

With the development of Web 2.0, social media has become a large data source for information on ADEs. The objective of this study was to develop a relation extraction system that uses natural language processing techniques to effectively distinguish between ADEs and non-ADEs in informal text on social media. The authors developed a feature-based approach that utilizes various lexical, syntactic, and semantic features. Information-gain-based feature selection is performed to address high-dimensional features. Then, they evaluated the effectiveness of four well-known kernel-based approaches (i.e., subset tree kernel, tree kernel, shortest dependency path kernel, and all-paths graph kernel) and several ensembles that are generated by adopting different combination methods (i.e., majority voting, weighted averaging, and stacked generalization). All of the approaches are tested using three data sets: two health-related discussion forums and one general social networking site (i.e., Twitter). When investigating the contribution of each feature subset, the feature-based approach attains the best area under the receiver operating characteristics curve (AUC) values, which are 78.6%, 72.2%, and 79.2% on the three data sets. When individual methods are used, we attain the best AUC values of 82.1%, 73.2%, and 77.0% using the subset tree kernel, shortest dependency path kernel, and feature-based approach on the three data sets, respectively. When using classifier ensembles, we achieve the best AUC values of 84.5%, 77.3%, and 84.5% on the three data sets, outperforming the baselines. In conclusion, the experimental results indicate that ADE extraction from social media can benefit from feature selection. With respect to the effectiveness of different feature subsets, lexical features and semantic features can enhance the ADE extraction capability. Kernel-based approaches, which can stay away from the feature sparsity issue, are qualified to address the ADE extraction problem. Combining different individual classifiers using suitable combination methods can further enhance the ADE extraction effectiveness.

Eshleman R, Singh R. Leveraging Graph Topology and Semantic Context for Pharmacovigilance through Twitter-streams. BMC Bioinformatics 2016;17(Suppl 13):335.

Adverse drug events (ADEs) constitute one of the leading causes of post-therapeutic death and their identification constitutes an important challenge of modern precision medicine. Unfortunately, the onset and effects of ADEs are often underreported complicating timely intervention. At over 500 million posts per day, Twitter is a commonly used social media platform. The ubiquity of day-to-day personal information exchange on Twitter makes it a promising target for data mining for ADE identification and intervention. Three technical challenges are central to this problem: (1) identification of salient medical keywords in (noisy) tweets, (2) mapping drug-effect relationships, and (3) classification of such relationships as adverse or non-adverse. The authors used a bipartite graph-theoretic representation called a drug-effect graph (DEG) for modeling drug and side effect relationships by representing the drugs and side effects as vertices. We construct individual DEGs on two data sources. The first DEG is constructed from the drug-effect relationships found in FDA package inserts as recorded in the SIDER database. The second DEG is constructed by mining the history of Twitter users. We use dictionary-based information extraction to identify medically-relevant concepts in tweets. Drugs, along with co-occurring symptoms are connected with edges weighted by temporal distance and frequency. Finally, information from the SIDER DEG is integrate with the Twitter DEG and edges are classified as either adverse or non-adverse using supervised machine learning.
The authors examined both graph-theoretic and semantic features for the classification task. The proposed approach can identify adverse drug effects with high accuracy with precision exceeding 85 % and F1 exceeding 81 %. When compared with leading methods at the state-of-the-art, which employ un-enriched graph-theoretic analysis alone, our method leads to improvements ranging between 5 and 8 % in terms of the aforementioned measures. Additionally, we employ our method to discover several ADEs which, though present in medical literature and Twitter-streams, are not represented in the SIDER databases. In conclusion, the authors present a DEG integration model as a powerful formalism for the analysis of drug-effect relationships that is general enough to accommodate diverse data sources, yet rigorous enough to provide a strong mechanism for ADE identification.

Koutkias VG, Lillo-le-Louet A, Jaulent MC. Exploiting Heterogeneous Publicly Available Data Sources for Drug Safety Surveillance: Computational Framework and Case Studies. Expert Opin Drug Saf 2017;16(2):113-24.

In this article, the authors introduce and validate a computational framework exploiting dominant as well as emerging publicly available data sources for drug safety surveillance. Their approach relies on appropriate query formulation for data acquisition and subsequent filtering, transformation and joint visualization of the obtained data. Data from the FDA Adverse Event Reporting System (FAERS), PubMed and Twitter were used. In order to assess the validity and the robustness of the approach, the authors elaborated on two important case studies, namely, clozapine-induced cardiomyopathy/myocarditis versus haloperidol-induced cardiomyopathy/myocarditis, and apixaban-induced cerebral hemorrhage.
The analysis of the obtained data provided interesting insights (identification of potential patient and health-care professional experiences regarding ADRs in Twitter, information/arguments against an ADR existence across all sources), while illustrating the benefits (complementing data from multiple sources to strengthen/confirm evidence) and the underlying challenges (selecting search terms, data presentation) of exploiting heterogeneous information sources, thereby advocating the need for the proposed framework. The authors concluded that this work contributes in establishing a continuous learning system for drug safety surveillance by exploiting heterogeneous publicly available data sources via appropriate support tools.

Pierce CE, Bouri K, Pamer C, Proestel S, Rodriguez HW, Van Le H, et al. Evaluation of Facebook and Twitter Monitoring to Detect Safety Signals for Medical Products: An Analysis of Recent FDA Safety Alerts. Drug Saf 2017;40(4):317-31.

The rapid expansion of the Internet and computing power in recent years has opened up the possibility of using social media for pharmacovigilance. While this general concept has been proposed by many, central questions remain as to whether social media can provide earlier warnings for rare and serious events than traditional signal detection from spontaneous report data. The objective was to examine whether specific product-adverse event pairs were reported via social media before being reported to the US FDA Adverse Event Reporting System (FAERS). A retrospective analysis of public Facebook and Twitter data was conducted for 10 recent FDA postmarketing safety signals at the drug-event pair level with six negative controls. Social media data corresponding to two years prior to signal detection of each product-event pair were compiled. Automated classifiers were used to identify each ‘post with resemblance to an adverse event’ (Proto-AE), among English language posts. A custom dictionary was used to translate Internet vernacular into Medical Dictionary for Regulatory Activities (MedDRA®) Preferred Terms. Drug safety physicians conducted a manual review to determine causality using World Health Organization-Uppsala Monitoring Centre (WHO-UMC) assessment criteria. Cases were also compared with those reported in FAERS.
A total of 935,246 posts were harvested from Facebook and Twitter, from March 2009 through October 2014. The automated classifier identified 98,252 Proto-AEs. Of these, 13 posts were selected for causality assessment of product-event pairs. Clinical assessment revealed that posts had sufficient information to warrant further investigation for two possible product-event associations: dronedarone-vasculitis and Banana Boat Sunscreen–skin burns. No product-event associations were found among the negative controls. In one of the positive cases, the first report occurred in social media prior to signal detection from FAERS, whereas the other case occurred first in FAERS.
In conclusion, an efficient semi-automated approach to social media monitoring may provide earlier insights into certain adverse events. More work is needed to elaborate additional uses for social media data in pharmacovigilance and to determine how they can be applied by regulatory agencies.

Cocos A, Fiks AG, Masino AJ. Deep Learning for Pharmacovigilance: Recurrent Neural Network Architectures for Labeling Adverse Drug Reactions in Twitter Posts. J Am Med Inform Assoc 2017;24(4):813-21.

Social media is an important pharmacovigilance data source for adverse drug reaction (ADR) identification. As human review is infeasible due to data quantity, natural language processing techniques are necessary. Social media includes informal vocabulary and irregular grammar, which challenge natural language processing methods. The objective of this study was to develop a scalable, deep-learning approach that exceeds state-of-the-art ADR detection performance in social media. The authors developed a recurrent neural network (RNN) model that labels words in an input sequence with ADR membership tags. The only input features are word-embedding vectors, which can be formed through task-independent pretraining or during ADR detection training.
Our best-performing RNN model used pretrained word embeddings created from a large, non-domain-specific Twitter dataset. It achieved an approximate match F-measure of 0.755 for ADR identification on the dataset, compared to 0.631 for a baseline lexicon system and 0.65 for the state-of-the-art conditional random field model. Feature analysis indicated that semantic information in pretrained word embeddings boosted sensitivity and, combined with contextual awareness captured in the RNN, precision.
Our model required no task-specific feature engineering, suggesting generalizability to additional sequence-labeling tasks. Learning curve analysis showed that our model reached optimal performance with fewer training examples than the other models.
In conclusion, ADR detection performance in social media is significantly improved by using a contextually aware model and word embeddings formed from large, unlabeled datasets. The approach reduces manual data-labeling requirements and is scalable to large social media datasets.

Salathe M. Digital Pharmacovigilance and Disease Surveillance: Combining Traditional and Big-Data Systems for Better Public Health. J Infect Dis 2016:214(suppl_4):S399-S403.

The digital revolution has contributed to very large data sets (ie, big data) relevant for public health. The two major data sources are electronic health records from traditional health systems and patient-generated data. As the two data sources have complementary strengths-high veracity in the data from traditional sources and high velocity and variety in patient-generated data-they can be combined to build more-robust public health systems. However, they also have unique challenges. Patient-generated data in particular are often completely unstructured and highly context dependent, posing essentially a machine-learning challenge. Some recent examples from infectious disease surveillance and adverse drug event monitoring demonstrate that the technical challenges can be solved. Despite these advances, the problem of verification remains, and unless traditional and digital epidemiologic approaches are combined, these data sources will be constrained by their intrinsic limits.

Comfort S, Perera S, Hudson Z, Dorrell D, Meireis S, Nagarajan M, et al. Sorting Through the Safety Data Haystack: Using Machine Learning to Identify Individual Case Safety Reports in Social-Digital Media. Drug Saf 2018;doi: 10.1007/s40264-018-0641-7.

There is increasing interest in social digital media (SDM) as a data source for pharmacovigilance activities; however, SDM is considered a low information content data source for safety data. Given that pharmacovigilance itself operates in a high-noise, lower-validity environment without objective ‘gold standards’ beyond process definitions, the introduction of large volumes of SDM into the pharmacovigilance workflow has the potential to exacerbate issues with limited manual resources to perform adverse event identification and processing. Recent advances in medical informatics have resulted in methods for developing programs which can assist human experts in the detection of valid individual case safety reports (ICSRs) within SDM. The objective of this study was to develop rule-based and machine learning (ML) models for classifying ICSRs from SDM and compared their performance with that of human pharmacovigilance experts. The authors used a random sampling from a collection of 311,189 SDM posts that mentioned Roche products and brands in combination with common medical and scientific terms sourced from Twitter, Tumblr, Facebook, and a spectrum of news media blogs to develop and evaluate three iterations of an automated ICSR classifier. The ICSR classifier models consisted of sub-components to annotate the relevant ICSR elements and a component to make the final decision on the validity of the ICSR. Agreement with human pharmacovigilance experts was chosen as the preferred performance metric and was evaluated by calculating the Gwet AC1 statistic (gKappa). The best performing model was tested against the Roche global pharmacovigilance expert using a blind dataset and put through a time test of the full 311,189-post dataset.
During this effort, the initial strict rule-based approach to ICSR classification resulted in a model with an accuracy of 65% and a gKappa of 46%. Adding an ML-based adverse event annotator improved the accuracy to 74% and gKappa to 60%. This was further improved by the addition of an additional ML ICSR detector. On a blind test set of 2500 posts, the final model demonstrated a gKappa of 78% and an accuracy of 83%. In the time test, it took the final model 48 h to complete a task that would have taken an estimated 44,000 h for human experts to perform.
In conclusion, the results of this study indicate that an effective and scalable solution to the challenge of ICSR detection in SDM includes a workflow using an automated ML classifier to identify likely ICSRs for further human SME review.


Jose Rossello
Jose Rossello

Filed Under: Twitter Tagged With: adverse drug reaction, adverse event, data mining, safety surveillance, social media, twitter

Big Data and Pharmacovigilance: Where are We Going?

January 26, 2018 by Jose Rossello Leave a Comment

Everyone talks about “big data”, and how it is going to transform many industries, including healthcare. In a recent work, Bate, Reynolds, and Caubel analyze and describe the achievements of big data approaches in pharmacoepidemiology, improvement on quality of data for drug safety research, and the role of big data in relation to the identification of potential safety signals in post-market surveillance, that is, the impact of big data on quantitative signal evaluation and the identification of potentially new safety signals.

In pharmacovigilance and signal detection, we have moved quickly from manual, paper-based methods for signal detection to spontaneous reporting systems that require electronic submission, but allow quantitative and qualitative analyses as part of signal management systems.

According to the authors:

While the core of regulated pharmacovigilance practice still centers on the collection of individual case safety reports, change is occurring, in part as a result of Big Data approaches. The greatest change in pharmacovigilance analytics being applied today, and the one most connected to the Big Data revolution, is the more sophisticated use of observational data, as evidenced by pharmacoepidemiologic studies conducted across multiple databases and the development of large networks of observational databases of Electronic Healthcare Records in North America.

The new pharmacovigilance analytics will go beyond safety assessment. It will provide value for research too. Examples will be comparative effectiveness studies, pragmatic trials or investigational trials in real-world settings. The FDA Sentinel Initiative is a clear example of this new approach.

The authors also talk about what is known as hypothesis-free signal detection with its advantages and limitations, consumer wearable technology for pharmacoepidemiologic research, the new data streams and technologies as a source for identifying potential new safety signals, and the need to critically evaluate the impact of innovative data sources and techniques.

For more information check out the complete article from Therapeutic Advances in Drug Safety.

Read the source article here: The hope, hype and reality of Big Data for pharmacovigilance.

Jose Rossello
Jose Rossello

Filed Under: Big Data

  • « Go to Previous Page
  • Page 1
  • Interim pages omitted …
  • Page 3
  • Page 4
  • Page 5

Primary Sidebar

Subscribe in a reader

Search Website

Uses of Generative AI in Pharmacovigilance

Featured News / Posts

Signal Analytics Technology in Pharmacovigilance

Signal Analytics Technology in Pharmacovigilance: Enhancing Drug Safety Monitoring

Pharmacovigilance plays a crucial role in ensuring public safety by monitoring, … [Read More...] about Signal Analytics Technology in Pharmacovigilance: Enhancing Drug Safety Monitoring

8 Common FDA Applications for Drugs & Biologics

The U.S. Food and Drug Administration (FDA) has several types of applications … [Read More...] about 8 Common FDA Applications for Drugs & Biologics

Key IND Enabling Studies: Navigating Preclinical Development Regulations

Investigational New Drug (IND) applications represent a critical stage in the … [Read More...] about Key IND Enabling Studies: Navigating Preclinical Development Regulations

Pharmacokinetics and Pharmacodynamics (PKPD): Fundamentals in Drug Development and Therapeutic Effectiveness

Pharmacokinetics and pharmacodynamics are two fundamental pillars in the field … [Read More...] about Pharmacokinetics and Pharmacodynamics (PKPD): Fundamentals in Drug Development and Therapeutic Effectiveness

Current Regulations Regarding Reference Safety Information (RSI): Key Aspects and Updates

Regulatory authorities in the pharmaceutical industry have established standards … [Read More...] about Current Regulations Regarding Reference Safety Information (RSI): Key Aspects and Updates

Methods of Statistical Signal Detection in Patient Safety and Pharmacovigilance: Key Techniques and Approaches

In the realm of patient safety and pharmacovigilance, statistical signal … [Read More...] about Methods of Statistical Signal Detection in Patient Safety and Pharmacovigilance: Key Techniques and Approaches

Pharmacovigilance Signal Detection Software: Enhancing Drug Safety and Monitoring

Pharmacovigilance signal detection software plays a crucial role in … [Read More...] about Pharmacovigilance Signal Detection Software: Enhancing Drug Safety and Monitoring

What is a PBRER? Understanding Periodic Benefit-Risk Evaluation Reports

A Periodic Benefit-Risk Evaluation Report (PBRER) serves as a structured … [Read More...] about What is a PBRER? Understanding Periodic Benefit-Risk Evaluation Reports

Drug Safety vs Pharmacovigilance: Exploring Conceptual Differences

Drug safety and pharmacovigilance are crucial aspects of public … [Read More...] about Drug Safety vs Pharmacovigilance: Exploring Conceptual Differences

Which Sections of a DSUR Must Present Safety and Pharmacovigilance Quantitative Data: Key Components Explained

he Development Safety Update Report (DSUR) is a crucial document that serves as … [Read More...] about Which Sections of a DSUR Must Present Safety and Pharmacovigilance Quantitative Data: Key Components Explained

  • What is a DSUR (Development Safety Update Report)? An Essential Guide for Clinical Research
  • What is a BLA (Biologics License Application)? Essential Guide for Professionals
  • What is a PADER? – Periodic Adverse Drug Experience Report Explained

RSS ICH News

  • An error has occurred, which probably means the feed is down. Try again later.

RSS From Nature journal

  • Predicting adverse drug reactions for combination pharmacotherapy with cross-scale associative learning via attention modules
  • PET-based tracking of CAR T cells and viral gene transfer using a cell surface reporter that binds to lanthanide complexes
  • Analysis and risk assessment of nitrosamines in sartans using GC-MS and Monte Carlo simulation
  • Medication safety analysis of elderly inpatients based on improved functional resonance analysis method (FRAM): a mixed methods study
  • Unraveling the mechanisms of irAEs in endometrial cancer immunotherapy: insights from FAERS and scRNA-seq data

Copyright © 2025 · News Pro on Genesis Framework · WordPress · Log in